Page 544 - Basic College Mathematics with Early Integers
P. 544

7.2       READING CIRCLE GRAPHS                                                 Objectives


                                                                                            Read Circle Graphs.

            Objective      Reading Circle Graphs                                            Draw Circle Graphs.

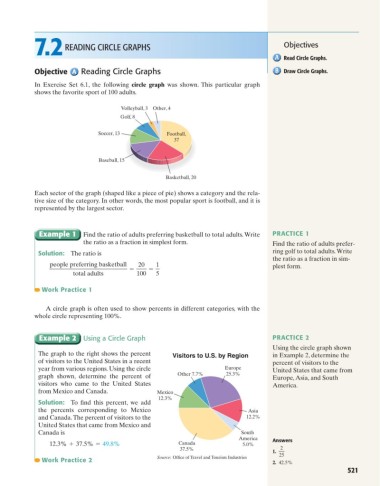
            In Exercise Set 6.1, the following  circle graph was shown. This particular graph
            shows the favorite sport of 100 adults.

                                        Volleyball, 3 Other, 4
                                       Golf, 8

                                Soccer, 13            Football,
                                                         37


                                Baseball, 15

                                                      Basketball, 20

            Each sector of the graph (shaped like a piece of pie) shows a category and the rela-
            tive size of the category. In other words, the most popular sport is football, and it is
            represented by the largest sector.


             Example 1      Find the ratio of adults preferring basketball to total adults.Write  PRACTICE 1
                            the ratio as a fraction in simplest form.                   Find the ratio of adults prefer-
             Solution:  The ratio is                                                    ring golf to total adults.Write
                                                                                        the ratio as a fraction in sim-
                 people preferring basketball  20  1                                    plest form.
                                          =      =
                        total adults         100   5
              Work Practice 1


                A circle graph is often used to show percents in different categories, with the
            whole circle representing 100%.


             Example 2 Using a Circle Graph                                             PRACTICE 2
                                                                                        Using the circle graph shown
             The graph to the right shows the percent   Visitors to U.S. by Region      in Example 2, determine the
             of visitors to the United States in a recent                               percent of visitors to the
             year from various regions. Using the circle                 Europe         United States that came from
             graph shown, determine the percent of        Other 7.7%     25.3%          Europe,Asia, and South
             visitors who came to the United States                                     America.
             from Mexico and Canada.               Mexico
                                                    12.3%
             Solution:  To find this percent, we add
             the percents corresponding to Mexico                               Asia
             and Canada.The percent of visitors to the                          12.2%
             United States that came from Mexico and
             Canada is                                                        South
                                                                             America    Answers
                 12.3% + 37.5% = 49.8%                    Canada              5.0%
                                                          37.5%                            2
                                                                                        1.
                                                                                          25
              Work Practice 2                      Source: Office of Travel and Tourism Industries  2. 42.5%
                                                                                                                521
   539   540   541   542   543   544   545   546   547   548   549