
Page 550 - Basic College Mathematics with Early Integers
P. 550
S E C T ION 7. 2 I READING CIRCLE GRAPHS 527
27.
Distribution of Large Dams by Continent
Continent Percent Degrees in Sector
Europe 19%
North America 32%
South America 3%
Asia 39%
Africa 5%
Australia 2%
(Source: International Commission on Large Dams)
28. Number of Times the “Are We There Yet?”
Question Is Asked of Parents During Road Trips
Percent Degrees in Sector
Never 20%
Once 11%
2–5 times 36%
6–10 times 14%
More than 10 times 19%
(Source: KRC Research for Goodyear Tire & Rubber Co.)
Review
Write the prime factorization of each number. See Section 3.2.
29. 20 30. 25 31. 40
32. 16 33. 85 34. 105
Concept Extensions
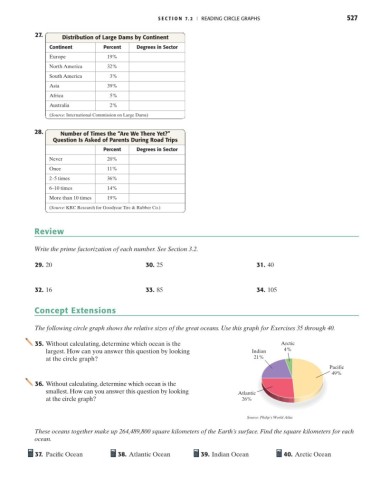
The following circle graph shows the relative sizes of the great oceans. Use this graph for Exercises 35 through 40.
35. Without calculating, determine which ocean is the Arctic
largest. How can you answer this question by looking Indian 4%
at the circle graph? 21%
Pacific
49%
36. Without calculating, determine which ocean is the
smallest. How can you answer this question by looking Atlantic
at the circle graph? 26%
Source: Philip’s World Atlas
These oceans together make up 264,489,800 square kilometers of the Earth’s surface. Find the square kilometers for each
ocean.
37. Pacific Ocean 38. Atlantic Ocean 39. Indian Ocean 40. Arctic Ocean