
Page 553 - Basic College Mathematics with Early Integers
P. 553
530 C HAPTE R 7 I STATISTICS AND PROBABILITY
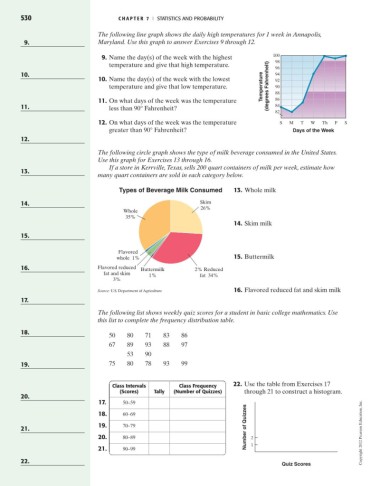
The following line graph shows the daily high temperatures for 1 week in Annapolis,
9. Maryland. Use this graph to answer Exercises 9 through 12.
9. Name the day(s) of the week with the highest 100
98
temperature and give that high temperature. 96
10. 94
10. Name the day(s) of the week with the lowest 92
temperature and give that low temperature. Temperature (degrees Fahrenheit) 90
88
11. On what days of the week was the temperature 86
11. less than 90° Fahrenheit? 84
82
12. On what days of the week was the temperature S M T W Th F S
greater than 90° Fahrenheit? Days of the Week
12.
The following circle graph shows the type of milk beverage consumed in the United States.
Use this graph for Exercises 13 through 16.
If a store in Kerrville,Texas, sells 200 quart containers of milk per week, estimate how
13.
many quart containers are sold in each category below.
Types of Beverage Milk Consumed 13. Whole milk
14. Skim
26%
Whole
35%
14. Skim milk
15.
Flavored
whole 1% 15. Buttermilk
16. Flavored reduced Buttermilk 2% Reduced
fat and skim
1% fat 34%
3%
Source: U.S. Department of Agriculture 16. Flavored reduced fat and skim milk
17.
The following list shows weekly quiz scores for a student in basic college mathematics. Use
this list to complete the frequency distribution table.
18.
50 80 71 83 86
67 89 93 88 97
53 90
19. 75 80 78 93 99
Class Intervals Class Frequency 22. Use the table from Exercises 17
(Scores) Tally (Number of Quizzes) through 21 to construct a histogram.
20.
17. 50–59
18. 60–69
19. 70–79
21. Number of Quizzes
20. 80–89 2 Copyright 2012 Pearson Education, Inc.
21. 90–99 1
22.
Quiz Scores