
Page 291 - Fiber Optic Communications Fund
P. 291
272 Fiber Optic Communications
P sat is known as the saturation power. When P ≪ P , g ≈ g . Therefore, g is known as a small signal gain.
0
0
sat
When P is comparable with P , g decreases. This is because, as the photon density increases, the stimulated
sat
emission rate increases, which depletes the carriers in the conduction band and from Eq. (6.142) it follows
that g decreases as N decreases. The evolution of power in the amplifier is given by
e
( )
dP Γg 0
= − P. (6.149)
dz 1 + P∕P sat
The single-pass gain is
P(L)
G = . (6.150)
s
P(0)
When the internal loss ( ≈ 0) is small, Eq. (6.149) may be rewritten as
( )
1 + P∕P sat
dP =Γg dz. (6.151)
0
P
Integrating Eq. (6.151) from 0 to amplifier length L, we obtain
P(L) [ ] L
1 1
∫ P + P dP = ∫ Γg dz,
0
P(0) sat 0
P(L) P(L)− P(0)
ln + =Γg L. (6.152)
0
P(0) P
sat
Let
G = exp(Γg L) (6.153)
s 0 0
G s 0
20 Saturation region
18
16
14
Gain (dB) 12
10
8
6
4
2
0
–15 –10 –5 0 5 10 15 20 25 30 35
Input signal power (dBm)
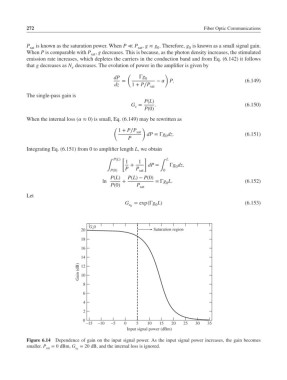
Figure 6.14 Dependence of gain on the input signal power. As the input signal power increases, the gain becomes
smaller. P sat = 0dBm, G = 20 dB, and the internal loss is ignored.
s 0