
Page 475 - Fiber Optic Communications Fund
P. 475
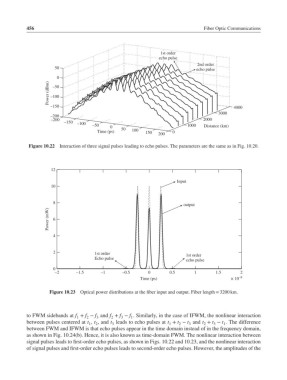
456                                                               Fiber Optic Communications


                                                              1st order
                                                             echo pulse
                                                                           2nd order
                       50                                                  echo pulse
                        0
                     Power (dBm)   –100
                      –50


                     –150                                                                4000
                                                                                   3000
                     –200
                     –200                                                    2000
                          –150  –100
                                     –50                               1000   Distance (km)
                                           0
                                      Time (ps)   50  100  150  200  0
             Figure 10.22  Interaction of three signal pulses leading to echo pulses. The parameters are the same as in Fig. 10.20.


                     12

                                                                    Input
                     10


                      8
                                                                      output
                    Power (mW)  6


                      4


                      2              1st order
                                     Echo pulse                        1st order
                                                                       echo pulse
                      0
                       –2      –1.5     –1      –0.5     0       0.5      1       1.5      2
                                                      Time (ps)                        × 10 –8
                     Figure 10.23  Optical power distributions at the fiber input and output. Fiber length = 3200 km.


            to FWM sidebands at f + f − f and f + f − f . Similarly, in the case of IFWM, the nonlinear interaction
                                                   1
                                               3
                                            2
                                   2
                                      3
                               1
            between pulses centered at t , t , and t leads to echo pulses at t + t − t and t + t − t . The difference
                                                                        3
                                                                              2
                                                                                     1
                                                                                 3
                                                                    2
                                   1
                                                                 1
                                            3
                                      2
            between FWM and IFWM is that echo pulses appear in the time domain instead of in the frequency domain,
            as shown in Fig. 10.24(b). Hence, it is also known as time-domain FWM. The nonlinear interaction between
            signal pulses leads to first-order echo pulses, as shown in Figs. 10.22 and 10.23, and the nonlinear interaction
            of signal pulses and first-order echo pulses leads to second-order echo pulses. However, the amplitudes of the