
Page 441 - Introduction to Business
P. 441
CHAPTER 12 Financial Reporting 415
Investing Activities. Investing activities include sales and purchases of long-
term assets that are used in business operations. This is the second most critical of
the three categories of business activities. For the year ended December 31, 2004,
Cathy’s Candy Company’s largest cash outflow from investing activities was $2,391
million for the purchase of property and equipment (line 9).
Financing Activities. Financing activities include borrowing, issuing stock,
purchasing treasury stock, and paying cash dividends. For 2004, the largest financ-
ing cash flow was a $2,676 million purchase of treasury stock.
The chief aim of the statement of cash flows is to ascertain why the amount of
cash changed during the year. The amount of the change can be readily determined
by calculating the difference between cash at the beginning of the year and cash at
the end of the year. For 2004, the net decrease in cash of $1,035 million is the dif-
ference between the start of the year figure, $2,745 million (December 31, 2003/
January 1, 2004), and the end of the year figure, $1,710 million (December 31, 2004).
Thus, Cathy’s Candy Company ends the year with $1,710 million in cash (line 21 of
Exhibit 12.5 and line 1 of Exhibit 12.4).
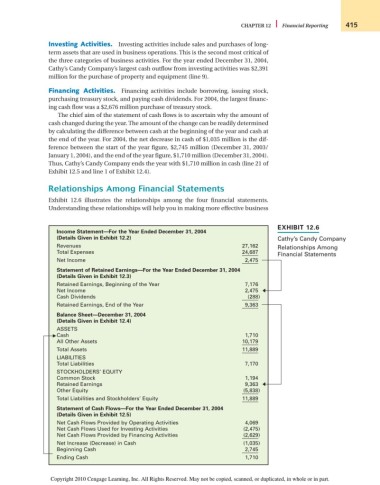
Relationships Among Financial Statements
Exhibit 12.6 illustrates the relationships among the four financial statements.
Understanding these relationships will help you in making more effective business
EXHIBIT 12.6
Income Statement—For the Year Ended December 31, 2004
(Details Given in Exhibit 12.2) Cathy’s Candy Company
Revenues 27,162 Relationships Among
Total Expenses 24,687
Financial Statements
Net Income 2,475
Statement of Retained Earnings—For the Year Ended December 31, 2004
(Details Given in Exhibit 12.3)
Retained Earnings, Beginning of the Year 7,176
Net Income 2,475
Cash Dividends (288)
Retained Earnings, End of the Year 9,363
Balance Sheet—December 31, 2004
(Details Given in Exhibit 12.4)
ASSETS
Cash 1,710
All Other Assets 10,179
Total Assets 11,889
LIABILITIES
Total Liabilities 7,170
STOCKHOLDERS’ EQUITY
Common Stock 1,194
Retained Earnings 9,363
Other Equity (5,838)
Total Liabilities and Stockholders’ Equity 11,889
Statement of Cash Flows—For the Year Ended December 31, 2004
(Details Given in Exhibit 12.5)
Net Cash Flows Provided by Operating Activities 4,069
Net Cash Flows Used for Investing Activities (2,475)
Net Cash Flows Provided by Financing Activities (2,629)
Net Increase (Decrease) in Cash (1,035)
Beginning Cash 2,745
Ending Cash 1,710
Copyright 2010 Cengage Learning, Inc. All Rights Reserved. May not be copied, scanned, or duplicated, in whole or in part.