
Page 436 - Introduction to Business
P. 436
410 PART 4 Accounting
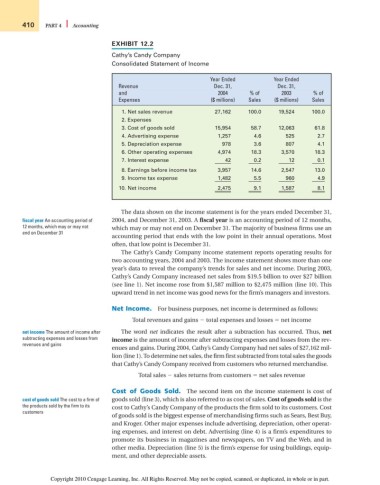
EXHIBIT 12.2
Cathy’s Candy Company
Consolidated Statement of Income
Year Ended Year Ended
Revenue Dec. 31, Dec. 31,
and 2004 % of 2003 % of
Expenses ($ millions) Sales ($ millions) Sales
1. Net sales revenue 27,162 100.0 19,524 100.0
2. Expenses
3. Cost of goods sold 15,954 58.7 12,063 61.8
4. Advertising expense 1,257 4.6 525 2.7
5. Depreciation expense 978 3.6 807 4.1
6. Other operating expenses 4,974 18.3 3,570 18.3
7. Interest expense 42 0.2 12 0.1
8. Earnings before income tax 3,957 14.6 2,547 13.0
9. Income tax expense 1,482 5.5 960 4.9
10. Net income 2,475 9.1 1,587 8.1
The data shown on the income statement is for the years ended December 31,
fiscal year An accounting period of 2004, and December 31, 2003. A fiscal year is an accounting period of 12 months,
12 months, which may or may not which may or may not end on December 31. The majority of business firms use an
end on December 31
accounting period that ends with the low point in their annual operations. Most
often, that low point is December 31.
The Cathy’s Candy Company income statement reports operating results for
two accounting years, 2004 and 2003. The income statement shows more than one
year’s data to reveal the company’s trends for sales and net income. During 2003,
Cathy’s Candy Company increased net sales from $19.5 billion to over $27 billion
(see line 1). Net income rose from $1,587 million to $2,475 million (line 10). This
upward trend in net income was good news for the firm’s managers and investors.
Net Income. For business purposes, net income is determined as follows:
Total revenues and gains total expenses and losses net income
net income The amount of income after The word net indicates the result after a subtraction has occurred. Thus, net
subtracting expenses and losses from income is the amount of income after subtracting expenses and losses from the rev-
revenues and gains
enues and gains. During 2004, Cathy’s Candy Company had net sales of $27,162 mil-
lion (line 1). To determine net sales, the firm first subtracted from total sales the goods
that Cathy’s Candy Company received from customers who returned merchandise.
Total sales sales returns from customers net sales revenue
Cost of Goods Sold. The second item on the income statement is cost of
cost of goods sold The cost to a firm of goods sold (line 3), which is also referred to as cost of sales. Cost of goods sold is the
the products sold by the firm to its cost to Cathy’s Candy Company of the products the firm sold to its customers. Cost
customers
of goods sold is the biggest expense of merchandising firms such as Sears, Best Buy,
and Kroger. Other major expenses include advertising, depreciation, other operat-
ing expenses, and interest on debt. Advertising (line 4) is a firm’s expenditures to
promote its business in magazines and newspapers, on TV and the Web, and in
other media. Depreciation (line 5) is the firm’s expense for using buildings, equip-
ment, and other depreciable assets.
Copyright 2010 Cengage Learning, Inc. All Rights Reserved. May not be copied, scanned, or duplicated, in whole or in part.