
Page 23 - CIMA MCS Workbook November 2018 - Day 1 Suggested Solutions
P. 23
SUGGESTED SOLUTIONS
CHAPTER SIX
1. ANALYSIS OF PERFORMANCE AND POSITION
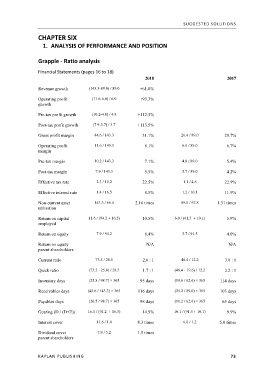
Grapple ‐ Ratio analysis
Financial Statements (pages 16 to 18)
2018 2017
Revenue growth (143.3-89.0) / 89.0 +61.0%
Operating profit (11.6-6.0) / 6.0 +93.3%
growth
Pre-tax profit growth (10.2-4.8) / 4.8 +112.5%
Post-tax profit growth (7.9-3.7) / 3.7 +113.5%
Gross profit margin 44.6 / 143.3 31.1% 26.4 / 89.0 29.7%
Operating profit 11.6 / 143.3 8.1% 6.0 / 89.0 6.7%
margin
Pre-tax margin 10.2 / 143.3 7.1% 4.8 / 89.0 5.4%
Post-tax margin 7.9 / 143.3 5.5% 3.7 / 89.0 4.2%
Effective tax rate 2.3 / 10.2 22.5% 1.1 / 4.8 22.9%
Effective interest rate 1.4 / 16.5 8.5% 1.2 / 10.1 11.9%
Non-current asset 143.3 / 66.4 2.16 times 89.0 / 67.8 1.31 times
utilisation
Return on capital 11.6 / (94.2 + 16.5) 10.5% 6.0 / (91.5 + 10.1) 5.9%
employed
Return on equity 7.9 / 94.2 8.4% 3.7 / 91.5 4.0%
Return on equity – N/A N/A
parent shareholders
Current ratio 73.5 / 28.5 2.6 : 1 46.4 / 12.2 3.8 : 1
Quick ratio (73.5 - 25.8) / 28.5 1.7 : 1 (46.4 - 19.6) / 12.2 2.2 : 1
Inventory days (25.8 / 98.7) × 365 95 days (19.6 / 62.6) × 365 114 days
Receivables days (45.6 / 143.3) × 365 116 days (25.2 / 89.0) × 365 103 days
Payables days (26.5 / 98.7) × 365 98 days (11.2 / 62.6) × 365 65 days
Gearing (D / (D+E)) 16.5 / (94.2 + 16.5) 14.9% 10.1 / (91.5 + 10.1) 9.9%
Interest cover 11.6 / 1.4 8.3 times 6.0 / 1.2 5.0 times
Dividend cover – 7.9 / 5.2 1.5 times
parent shareholders
KAPLAN PUBLISHING 73