
Page 185 - BA2 Integrated Workbook - Student 2017
P. 185
Risk 2: probability
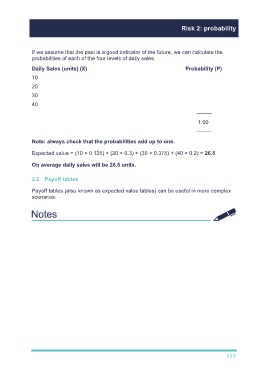
If we assume that the past is a good indicator of the future, we can calculate the
probabilities of each of the four levels of daily sales.
Daily Sales (units) (X) Probability (P)
10 5 ÷ 40 = 0.125
20 12 ÷ 40 = 0.30
30 15 ÷ 40 = 0.375
40 8 ÷ 40 = 0.20
–––––
1.00
–––––
Note: always check that the probabilities add up to one.
Expected value = (10 × 0.125) + (20 × 0.3) + (30 × 0.375) + (40 × 0.2) = 26.5
On average daily sales will be 26.5 units.
2.2 Payoff tables
Payoff tables (also known as expected value tables) can be useful in more complex
scenarios.
Try TYU 5
Go over illustration 4
Try TYU 7
177