
Page 189 - BA2 Integrated Workbook - Student 2017
P. 189
Risk 2: probability
Normal distribution
We will now combine what we have learned about probability with what we learned in
the previous chapter about mean and standard deviation and look at normal
distributions. Distribution refers to the way data is spread out.
Remember in the previous chapter we looked at calculating mean (μ) and standard
deviation (σ). These will be used in normal distribution.
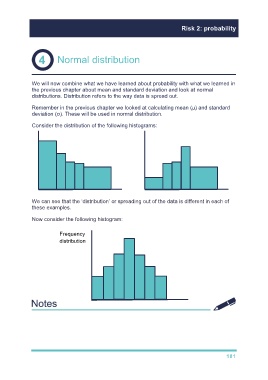
Consider the distribution of the following histograms:
We can see that the ‘distribution’ or spreading out of the data is different in each of
these examples.
Now consider the following histogram:
Frequency
distribution
181