
Page 191 - BA2 Integrated Workbook - Student 2017
P. 191
Risk 2: probability
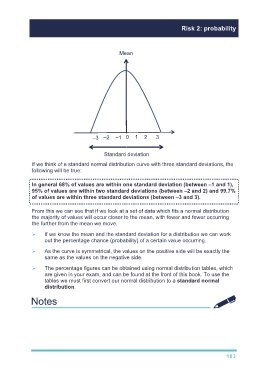
Mean
–3 –2 –1 0 1 2 3
Standard deviation
If we think of a standard normal distribution curve with three standard deviations, the
following will be true:
In general 68% of values are within one standard deviation (between –1 and 1),
95% of values are within two standard deviations (between –2 and 2) and 99.7%
of values are within three standard deviations (between –3 and 3).
From this we can see that if we look at a set of data which fits a normal distribution
the majority of values will occur closer to the mean, with fewer and fewer occurring
the further from the mean we move.
If we know the mean and the standard deviation for a distribution we can work
out the percentage chance (probability) of a certain value occurring.
As the curve is symmetrical, the values on the positive side will be exactly the
same as the values on the negative side.
The percentage figures can be obtained using normal distribution tables, which
are given in your exam, and can be found at the front of this book. To use the
tables we must first convert our normal distribution to a standard normal
distribution.
183