
Page 47 - BA2 Integrated Workbook STUDENT 2018
P. 47
Analysing and predicting costs
High-Low method
This method picks out the highest and lowest activity levels from the available data
and investigates the change in cost which has occurred between them.
From this, the variable cost per unit and the fixed cost element can be calculated.
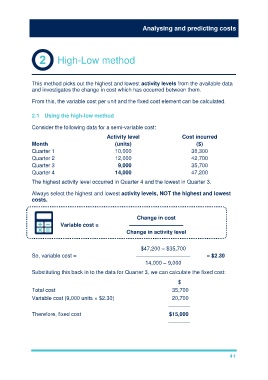
2.1 Using the high-low method
Consider the following data for a semi-variable cost:
Activity level Cost incurred
Month (units) ($)
Quarter 1 10,000 38,300
Quarter 2 12,000 42,700
Quarter 3 9,000 35,700
Quarter 4 14,000 47,200
The highest activity level occurred in Quarter 4 and the lowest in Quarter 3.
Always select the highest and lowest activity levels, NOT the highest and lowest
costs.
Change in cost
Variable cost = ––––––––––––––––––
Change in activity level
$47,200 – $35,700
So, variable cost = –––––––––––––––––– = $2.30
14,000 – 9,000
Substituting this back in to the data for Quarter 3, we can calculate the fixed cost:
$
Total cost 35,700
Variable cost (9,000 units × $2.30) 20,700
————
Therefore, fixed cost $15,000
————
41