
Page 51 - BA2 Integrated Workbook STUDENT 2018
P. 51
Analysing and predicting costs
3.2 Using a scatter graph
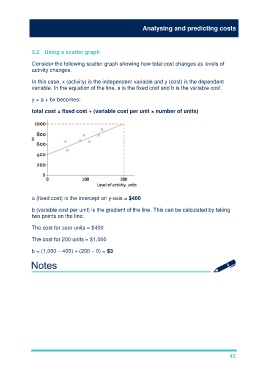
Consider the following scatter graph showing how total cost changes as levels of
activity changes.
In this case, x (activity) is the independent variable and y (cost) is the dependent
variable. In the equation of the line, a is the fixed cost and b is the variable cost.
y = a + bx becomes:
total cost = fixed cost + (variable cost per unit × number of units)
a (fixed cost) is the intercept on y-axis = $400
b (variable cost per unit) is the gradient of the line. This can be calculated by taking
two points on the line:
The cost for zero units = $400
The cost for 200 units = $1,000
b = (1,000 – 400) ÷ (200 – 0) = $3
45