Page 53 - BA2 Integrated Workbook STUDENT 2018
P. 53

Analysing and predicting costs


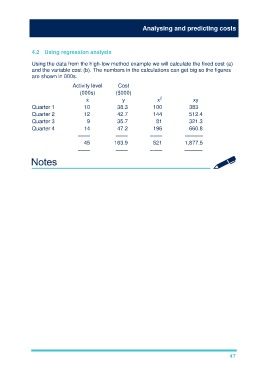
               4.2   Using regression analysis

               Using the data from the high-low method example we will calculate the fixed cost (a)
               and the variable cost (b). The numbers in the calculations can get big so the figures
               are shown in 000s.

                                 Activity level      Cost
                                     (000s)         ($000)
                                                                        2
                                       x               y               x               xy
               Quarter 1              10             38.3            100             383
               Quarter 2              12             42.7            144             512.4
               Quarter 3                9            35.7             81             321.3
               Quarter 4              14             47.2            196             660.8
                                    ––––            ––––            ––––           ––––––
                                      45            163.9            521           1,877.5
                                    ––––            ––––            ––––           ––––––


                                                                                                       47
   48   49   50   51   52   53   54   55   56   57   58