
Page 50 - BA2 Integrated Workbook STUDENT 2018
P. 50
Chapter 3
Scatter graph method
3.1 Drawing a scatter graph
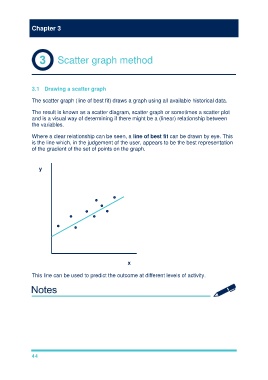
The scatter graph (line of best fit) draws a graph using all available historical data.
The result is known as a scatter diagram, scatter graph or sometimes a scatter plot
and is a visual way of determining if there might be a (linear) relationship between
the variables.
Where a clear relationship can be seen, a line of best fit can be drawn by eye. This
is the line which, in the judgement of the user, appears to be the best representation
of the gradient of the set of points on the graph.
y
ion
x
ion
This line can be used to predict the outcome at different levels of activity.
44