Page 495 - F2 - MA Integrated Workbook STUDENT 2018-19
P. 495

Answers


               Chapter 12


                   Example 1


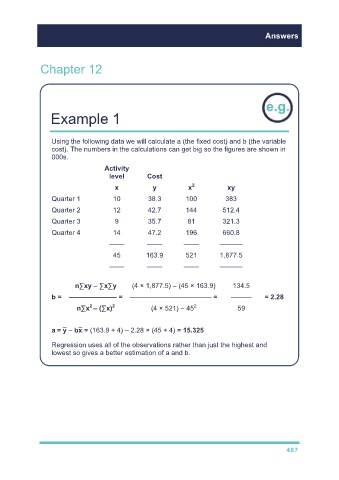
                   Using the following data we will calculate a (the fixed cost) and b (the variable
                   cost). The numbers in the calculations can get big so the figures are shown in
                   000s.
                                      Activity
                                       level         Cost
                                                                    2
                                         x             y           x             xy
                   Quarter 1             10          38.3         100           383
                   Quarter 2             12          42.7         144          512.4

                   Quarter 3             9           35.7          81          321.3
                   Quarter 4             14          47.2         196          660.8

                                       ––––          ––––         ––––        ––––––
                                         45         163.9         521         1,877.5

                                       ––––          ––––         ––––        ––––––

                           n∑xy – ∑x∑y         (4 × 1,877.5) – (45 × 163.9)        134.5
                   b =   ——————— =  ———————————— =                                ———         = 2.28
                                        2
                                 2
                            n∑x – (∑x)                (4 × 521) − 45 2              59


                   a = y – bx = (163.9 ÷ 4) – 2.28 × (45 ÷ 4) = 15.325

                   Regression uses all of the observations rather than just the highest and
                   lowest so gives a better estimation of a and b.


                                                                                                      487
   490   491   492   493   494   495   496   497   498   499   500