
Page 497 - F2 - MA Integrated Workbook STUDENT 2018-19
P. 497
Answers
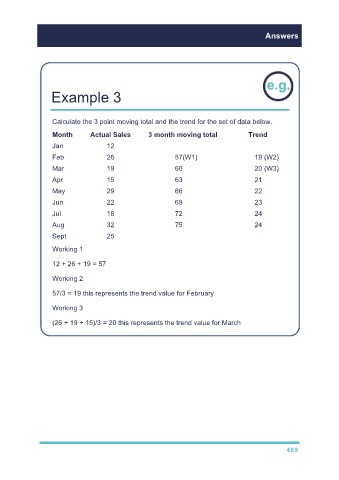
Example 3
Calculate the 3 point moving total and the trend for the set of data below.
Month Actual Sales 3 month moving total Trend
Jan 12
Feb 26 57(W1) 19 (W2)
Mar 19 60 20 (W3)
Apr 15 63 21
May 29 66 22
Jun 22 69 23
Jul 18 72 24
Aug 32 75 24
Sept 25
Working 1
12 + 26 + 19 = 57
Working 2
57/3 = 19 this represents the trend value for February
Working 3
(26 + 19 + 15)/3 = 20 this represents the trend value for March
489