
Page 498 - F2 - MA Integrated Workbook STUDENT 2018-19
P. 498
Chapter 18
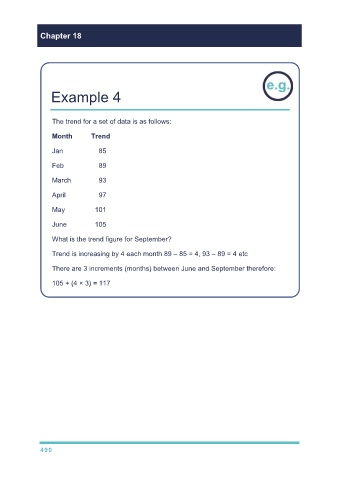
Example 4
The trend for a set of data is as follows:
Month Trend
Jan 85
Feb 89
March 93
April 97
May 101
June 105
What is the trend figure for September?
Trend is increasing by 4 each month 89 – 85 = 4, 93 – 89 = 4 etc
There are 3 increments (months) between June and September therefore:
105 + (4 × 3) = 117
490