
Page 12 - FINAL CFA II SLIDES JUNE 2019 DAY 6
P. 12
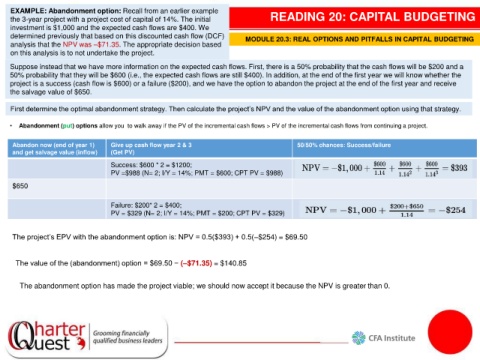
EXAMPLE: Abandonment option: Recall from an earlier example
    the 3-year project with a project cost of capital of 14%. The initial         READING 20: CAPITAL BUDGETING
    investment is $1,000 and the expected cash flows are $400. We
    determined previously that based on this discounted cash flow (DCF)    MODULE 20.3: REAL OPTIONS AND PITFALLS IN CAPITAL BUDGETING
    analysis that the NPV was –$71.35. The appropriate decision based
    on this analysis is to not undertake the project.

    Suppose instead that we have more information on the expected cash flows. First, there is a 50% probability that the cash flows will be $200 and a
    50% probability that they will be $600 (i.e., the expected cash flows are still $400). In addition, at the end of the first year we will know whether the
    project is a success (cash flow is $600) or a failure ($200), and we have the option to abandon the project at the end of the first year and receive
    the salvage value of $650.


    First determine the optimal abandonment strategy. Then calculate the project’s NPV and the value of the abandonment option using that strategy.

    •  Abandonment (put) options allow you  to walk away if the PV of the incremental cash flows > PV of the incremental cash flows from continuing a project.

     Abandon now (end of year 1)   Give up cash flow year 2 & 3                           50/50% chances: Success/failure
     and get salvage value (inflow)  (Get PV)
                                  Success: $600 * 2 = $1200;
                                  PV =$988 (N= 2; I/Y = 14%; PMT = $600; CPT PV = $988)
     $650


                                  Failure: $200* 2 = $400;
                                  PV = $329 (N= 2; I/Y = 14%; PMT = $200; CPT PV = $329)


     The project’s EPV with the abandonment option is: NPV = 0.5($393) + 0.5(–$254) = $69.50


      The value of the (abandonment) option = $69.50 − (–$71.35) = $140.85


       The abandonment option has made the project viable; we should now accept it because the NPV is greater than 0.