
Page 56 - FINAL CFA SLIDES JUNE 2019 DAY 2
P. 56
LOS 8.h: Calculate and interpret the proportion Session Unit 2:
of observations falling within a specified 8. Statistical Concepts and Market Returns (C)
number of standard deviations of the mean
using Chebyshev’s inequality, p.148
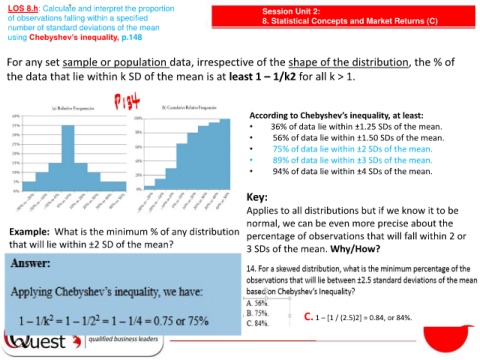
For any set sample or population data, irrespective of the shape of the distribution, the % of
the data that lie within k SD of the mean is at least 1 – 1/k2 for all k > 1.
According to Chebyshev’s inequality, at least:
• 36% of data lie within ±1.25 SDs of the mean.
• 56% of data lie within ±1.50 SDs of the mean.
• 75% of data lie within ±2 SDs of the mean.
• 89% of data lie within ±3 SDs of the mean.
• 94% of data lie within ±4 SDs of the mean.
Key:
Applies to all distributions but if we know it to be
normal, we can be even more precise about the
Example: What is the minimum % of any distribution
percentage of observations that will fall within 2 or
that will lie within ±2 SD of the mean? 3 SDs of the mean. Why/How?
C. 1 – [1 / (2.5)2] = 0.84, or 84%.