
Page 57 - FINAL CFA SLIDES JUNE 2019 DAY 2
P. 57
Session Unit 2:
LOS 8.i: Calculate and interpret the
coefficient of variation and the Sharpe 8. Statistical Concepts and Market Returns
ratio, p. 149
CV, is a measure of variation,
SD un top!
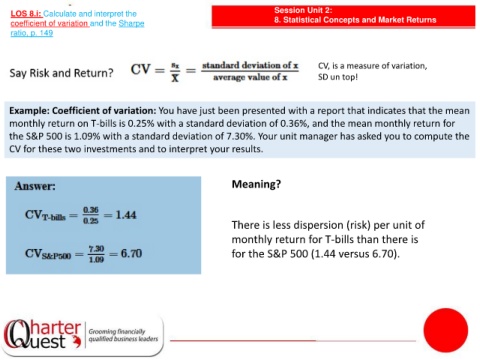
Example: Coefficient of variation: You have just been presented with a report that indicates that the mean
monthly return on T-bills is 0.25% with a standard deviation of 0.36%, and the mean monthly return for
the S&P 500 is 1.09% with a standard deviation of 7.30%. Your unit manager has asked you to compute the
CV for these two investments and to interpret your results.
Meaning?
There is less dispersion (risk) per unit of
monthly return for T-bills than there is
for the S&P 500 (1.44 versus 6.70).