
Page 28 - EN-Youth Report
P. 28
Data collection
Each SC member recruited male and female data collectors who hold deep ties to the respective
target communities, and trained them in administering surveys and individual interviews. SC
members conducted the surveys, KIIs, and FGDs in locations where they already have an active
presence and where they plan to work directly with youth residing in those communities to design,
develop, and implement small grant activities. Finally, to ensure proper targeting of young people
between 15-25 years of age, data collectors employed a snowball methodology, identifying
participants through referrals or encouraging others to come forward.
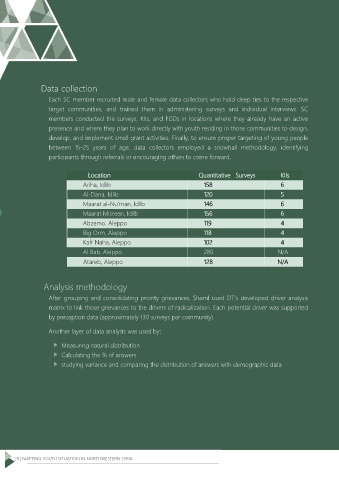
Location Quantitative Surveys KIIs
Ariha, Idlib 158 6
Al-Dana, Idlib 120 5
Maarat al-Nu’man, Idlib 146 6
Maarat Misreen, Idlib 156 6
Abzemo, Aleppo 119 4
Big Orm, Aleppo 118 4
Kafr Naha, Aleppo 102 4
Al Bab, Aleppo 280 N/A
Atareb, Aleppo 128 N/A
Analysis methodology
After grouping and consolidating priority grievances, Shaml used DT’s developed driver analysis
matrix to link those grievances to the drivers of radicalization. Each potential driver was supported
by perception data (approximately 130 surveys per community)
Another layer of data analysis was used by:
Measuring natural distribution
Calculating the % of answers
studying variance and comparing the distribution of answers with demographic data
28 | MAPPING YOUTH SITUATION IN NORTHWESTERN SYRIA