Page 381 - Services Selection Board (SSB) Interviews
P. 381

Miscellaneous Question Bank                                                                        QB-25
                (c)  P and R is nothing but K                    406. Which one of the areas marked I - VII represents the
                (d)  P or R is nothing but K                          urban educated who are not hardworking?
            Direction (Qs. 401 to 403): Identify the diagram                                       [SSC CGL 2015]
            that  best represents  the  relationship  among
            classes given below:             [SSC CGL 2015]                      I                 URBAN
            401. Tigers, Lions, Animals?                                      II
                                                                                III  IV           HARD WORKING
                                                                          VI    V   VII

                                                                                                   EDUCATED
                   (a)       (b)       (c)       (d)
            402. Language, English and Kannada?                       (a)  III               (b)  II
                                                                      (c)  I                 (d)  IV
                                                                 407. Identify the diagram that best  represents the
                                                                      relationship among classes given below:
                                                                                                 [SSC CHSL 2015]
                                                                      Social science, History and Geography
                    (a)       (b)       (c)       (d)
            403. Professors, Researchers, Scientists


                                                                          (a)        (b)         (c)        (d)
                                                                 408. Which  combination  figure best represents the
                   (a)       (b)       (c)       (d)                  relationship between mosquitoes, ants and insects?

            404. Identify the diagram that best  represents the                                  [SSC CHSL 2015]
                relationship among the classes given below:
                                             [SSC CGL 2015]           (a)                    (b)
                Soda Water, Mineral Water, Liquid

                                                                      (c)                    (d)


                                                                 409. Identify the diagram that best  represents the
                     (a)        (b)        (c)        (d)             relationship among classes given below:
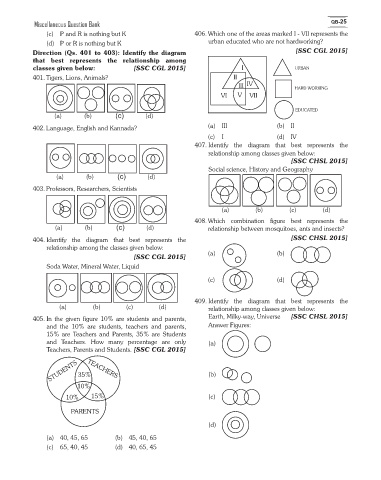
            405. In the given figure 10% are students and  parents,      Earth, Milky-way, Universe   [SSC CHSL 2015]
                and the 10% are students, teachers and parents,       Answer Figures:
                15% are Teachers  and  Parents, 35% are Students
                and Teachers. How many percentage  are only           (a)
                Teachers, Parents and Students. [SSC CGL 2015]

                 STUDENTS  35%                                        (b)

                              TEACHERS
                           10%
                       10%     15%                                    (c)

                        PARENTS

                                                                      (d)

                (a)  40, 45, 65        (b)  45, 40, 65
                (c)  65, 40, 45        (d)  40, 65, 45
   376   377   378   379   380   381   382   383   384   385   386