
Page 179 - AnnualEducationReport2018-19
P. 179
04/10/2019 Percent Emerging Percent Attained Percent Surpassed State Percent Students Proficient 14.3% 42.9% 42.9% 85.7% 23.3% 40.0% 36.7% 76.7% 0.0% 100.0% 0.0% 100.0% 100.0% 0.0% 0.0% 0.0% 0.0% 0.0% 100.0% 100.0% 29.4% 35.3% 35.3% 70.6% 30.8% 26.9% 42.3% 69.2% 47.1% 17.6% 35.3% 52.9% 42.3% 30.8% 26.9% 57.7% 6.3% 68.8% 25.0% 93.8% 15.4% 42.3% 42.3% 84.6% 17.6% 25.0% 57.4% 82.4% 24.0% 33.5% 42.5% 76.0% 26.8% 29.8% 43.5% 73.2% 39.6% 26.7% 33.7% 60.4% 11.2% 45.6% 43.2% 88.8% 12.2% 47.1% 40.8% 87.8% 13.3% 28.3% 58.3% 86.7% 20.6% 34.4% 4
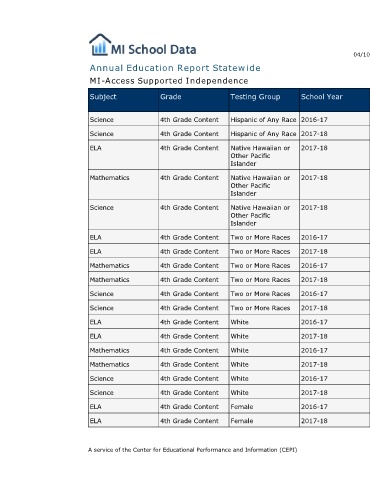
School Year 2016-17 2017-18 2017-18 2017-18 2017-18 2016-17 2017-18 2016-17 2017-18 2016-17 2017-18 2016-17 2017-18 2016-17 2017-18 2016-17 2017-18 2016-17 2017-18
Testing Group Hispanic of Any Race Hispanic of Any Race Native Hawaiian or Other Pacific Islander Native Hawaiian or Other Pacific Islander Native Hawaiian or Other Pacific Islander Two or More Races Two or More Races Two or More Races Two or More Races Two or More Races Two or More Races White White White White White White Female Female
Annual Education Report Statewide
MI-Access Supported Independence
4th Grade Content 4th Grade Content 4th Grade Content 4th Grade Content 4th Grade Content 4th Grade Content 4th Grade Content 4th Grade Content 4th Grade Content 4th Grade Content 4th Grade Content 4th Grade Content 4th Grade Content 4th Grade Content 4th Grade Content 4th Grade Content 4th Grade Content 4th Grade Content 4th Grade Content A service of the Center for Educational Performance and Information (CEPI)
Grade
Subject Science Science ELA Mathematics Science ELA ELA Mathematics Mathematics Science Science ELA ELA Mathematics Mathematics Science Science ELA ELA