
Page 2 - AnnualEducationReport2018-19
P. 2
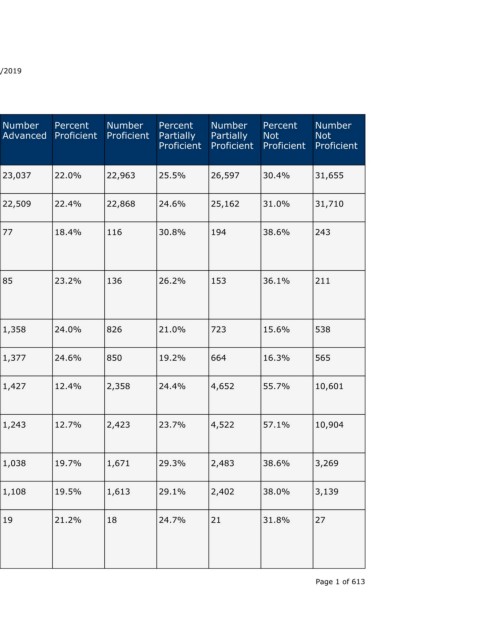
Number  Not  Proficient  31,655  31,710  243  211   538    565    10,601    10,904    3,269  3,139  27              Page 1 of 613


                                  Percent  Not  Proficient  30.4%  31.0%  38.6%  36.1%  15.6%  16.3%  55.7%   57.1%     38.6%  38.0%  31.8%


                                  Number  Partially  Proficient  26,597  25,162  194  153  723  664  4,652    4,522     2,483  2,402  21


                                  Percent  Partially  Proficient  25.5%  24.6%  30.8%  26.2%  21.0%  19.2%  24.4%  23.7%  29.3%  29.1%  24.7%


                                  Number  Proficient  22,963  22,868  116  136        826    850    2,358     2,423     1,671  1,613  18


                                  Percent  Proficient  22.0%  22.4%  18.4%  23.2%     24.0%  24.6%  12.4%     12.7%     19.7%  19.5%  21.2%


                    04/10/2019    Number  Advanced  23,037  22,509  77   85           1,358  1,377  1,427     1,243     1,038  1,108  19


                                  Percent  Advanced  22.1%  22.0%  12.2%  14.5%       39.4%  39.8%  7.5%      6.5%      12.3%  13.4%  22.4%


                                  State  Number  Students  Proficient  46,000  45,377  193  221  2,184  2,227  3,785  3,666  2,709  2,721  37


                                  State  Percent  Students  Proficient  44.1%  44.4%  30.6%  37.8%  63.4%  64.4%  19.9%  19.2%  32.0%  32.9%  43.5%
                        Annual Education Report Statewide


                                  School  Year  2016-17  2017-18  2016-17  2017-18    2016-17  2017-18  2016-17  2017-18  2016-17  2017-18  2016-17


                                  Testing  Group  All  Students  All  Students  American  Indian or  Alaska  Native  American  Indian or  Alaska  Native  Asian  Asian  Black or  African  American  Black or  African  American  Hispanic of  Any Race  Hispanic of  Any Race  Native  Hawaiian  or Other  Pacific  Islander A service of the Center for Educational Performance and Information (CEPI)


                             M-STEP Grades 3-11  Grade  Subject  3rd Grade  ELA  Content  3rd Grade  ELA  Content  3rd Grade  ELA  Content  3rd Grade  ELA  Content  3rd Grade  ELA  Content  3rd Grade  ELA  Content  3rd Grade  ELA  Content  3rd Grade  ELA  Content  3rd Grade  ELA  Content  3rd Grade  ELA  Content  3rd Grade  ELA  Content