
Page 307 - BCML AR 2019-20
P. 307
BALRAMPUR CHINI MILLS LIMITED
Notes forming part of the Consolidated Financial Statements
Note No. : 37 Other disclosures (Contd.)
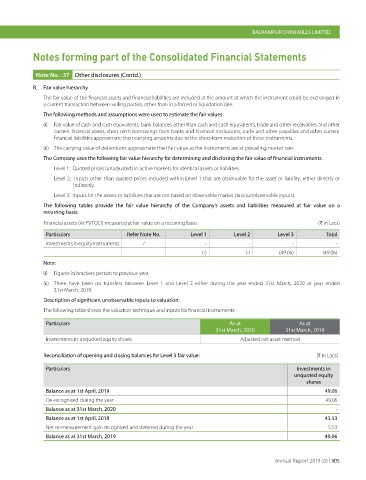
B. Fair value hierarchy
The fair value of the financial assets and financial liabilities are included at the amount at which the instrument could be exchanged in
a current transaction between willing parties, other than in a forced or liquidation sale.
The following methods and assumptions were used to estimate the fair values:
(i) Fair value of cash and cash equivalents, bank balances other than cash and cash equivalents, trade and other receivables and other
current financial assets, short term borrowings from banks and financial institutions, trade and other payables and other current
financial liabilities approximate their carrying amounts due to the short-term maturities of these instruments.
(ii) The carrying value of debentures approximate their fair value as the instruments are at prevailing market rate.
The Company uses the following fair value hierarchy for determining and disclosing the fair value of financial instruments:
Level 1: Quoted prices (unadjusted) in active markets for identical assets or liabilities.
Level 2: Inputs other than quoted prices included within Level 1 that are observable for the asset or liability, either directly or
indirectly.
Level 3: Inputs for the assets or liabilities that are not based on observable market data (unobservable inputs).
The following tables provide the fair value hierarchy of the Company’s assets and liabilities measured at fair value on a
recurring basis:
Financial assets (At FVTOCI) measured at fair value on a recurring basis (H in Lacs)
Particulars Refer Note No. Level 1 Level 2 Level 3 Total
Investments in equity instruments 7 - - - -
(-) (-) (49.06) (49.06)
Note:
(i) Figures in brackets pertain to previous year.
(ii) There have been no transfers between Level 1 and Level 2 either during the year ended 31st March, 2020 or year ended
31st March, 2019.
Description of significant unobservable inputs to valuation:
The following table shows the valuation technique and inputs for financial instruments:
Particulars As at As at
31st March, 2020 31st March, 2019
Investments in unquoted equity shares Adjusted net asset method
Reconciliation of opening and closing balances for Level 3 fair value: (H in Lacs)
Particulars Investments in
unquoted equity
shares
Balance as at 1st April, 2019 49.06
De-recognised during the year 49.06
Balance as at 31st March, 2020 -
Balance as at 1st April, 2018 43.53
Net re-measurement gain recognised and deferred during the year 5.53
Balance as at 31st March, 2019 49.06
Annual Report 2019-20 | 305