
Page 34 - NSAA 2017 Fall Journal
P. 34
The Koke Landscape
Final Figures on the 2016-17 Season
By Dave Belin, Director of Consulting Services, RRC Associates
hile most ski area operators are focused on the in and around the industry use this figure, commonly called
W upcoming 2017-18 season, the final results from the “skier visits,” as a shorthand for the size of a ski area and as a
prior winter season are now fully documented in the Kottke basic barometer for how the season performed. As well, the
End of Season Final Report. The survey data shows a very media focuses on this number to portray the season overall.
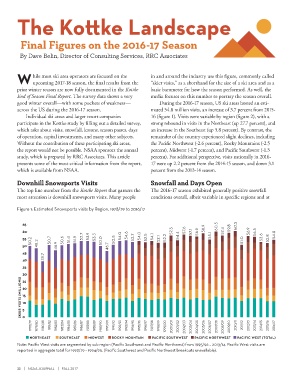
good winter overall—with some pockets of weakness— During the 2016-17 season, US ski areas hosted an esti-
across the US during the 2016-17 season. mated 54.8 million visits, an increase of 3.7 percent from 2015-
Individual ski areas and larger resort companies 16 (figure 1). Visits were variable by region (figure 2), with a
participate in the Kottke study by filling out a detailed survey, strong rebound in visits in the Northeast (up 27.7 percent), and
which asks about visits, snowfall, lessons, season passes, days an increase in the Southeast (up 5.8 percent). By contrast, the
of operation, capital investments, and many other subjects. remainder of the country experienced slight declines, including
Without the contribution of these participating ski areas, the Pacific Northwest (-2.6 percent), Rocky Mountains (-2.5
the report would not be possible. NSAA sponsors the annual percent), Midwest (-1.7 percent), and Pacific Southwest (-1.3
study, which is prepared by RRC Associates. This article percent). For additional perspective, visits nationally in 2016-
presents some of the most critical information from the report, 17 were up 2.2 percent from the 2014-15 season, and down 3.1
which is available from NSAA. percent from the 2013-14 season.
Downhill Snowsports Visits Snowfall and Days Open
The top line number from the Kottke Report that garners the The 2016-17 season exhibited generally positive snowfall
most attention is downhill snowsports visits. Many people conditions overall, albeit variable in specific regions and at
Figure 1: Estimated Snowsports visits by Region, 1978/79 to 2016/17
65
60
55
50
45
40
35
30
SKIERVISITSMILLIONS 20
25
15
10
5
0
/ / / / / / /
/ / / / / / / / / /
/ / / / / / / / / /
/ / / / / / / / / /
/ /
NORTHEAST SOUTHEAST MIDWEST ROCKYMOUNTAIN PACIFICSOUTHWEST PACIFICNORTHWEST PACIFICWESTTOTAL
Note: Pacific West visits are segmented by sub region (Pacific Southwest and Pacific Northwest) from 1995/96 – 2013/14. Pacific West visits are
reported in aggregate total for 1978/79 – 1994/95. (Pacific Southwest and Pacific Northwest breakouts unavailable).
32 | NSAA JOURNAL | FALL 2017