
Page 37 - NSAA 2017 Fall Journal
P. 37
Given the number of season passes sold (10,453 per weather) continues to be the most frequently cited factor, fol-
resort, up 11.4 percent) and the number of snowsports visits lowed by the economy. Other challenges identified include
generated by those passholders (104,753 per ski area, up 4.4 climate change, resort consolidation, minimum wages and
percent), it is estimated that the average season passholder other legislation/regulations, access to capital, increasing
skied/snowboarded 10 days in 2016-17, down from 10.6 days energy and insurance costs, expense of capital investment,
in 2015-16. The average number of visits by passholders at availability of seasonal and skilled labor, workforce housing,
any individual ski area can vary depending on a number of changing demographics, competition from other ski resorts,
factors, such as season pass price, size of the ski area, and maintaining/improving accessibility by air and ground, and
other reasons. The accuracy of the count of visits by season international exchange rates.
passholders has improved dramatically, as ski areas have been Meanwhile, opportunities cited included growing local
investing in more sophisticated ticket scanning and tracking populations, tapping new markets, capital investments that
technology and software. will improve/expand operations, increased summer and year-
round amenities, non-snow business, pass programs and
Takeaways on the Season partnerships, offering a distinctive experience relative to
This season showed the overall resilience and popularity of other ski resorts, more effective marketing and sales, and the
skiing and snowboarding, as downhill snowsports visits rose, upcoming Winter Olympics in 2018.
season pass sales were up, and both total lessons and Level 1 Resort personnel were also asked what they felt were
lessons increased. All these indicators suggest that the snow- the greatest limitations to attracting and retaining new
sports industry continues to make progress with a variety of participants to snowsports. Frequently mentioned as
customer segments. challenges were costs, lack of awareness, lack of time,
Ski areas were asked to identify the factors that will have a remote location/lack of easy accessibility, shortage
the biggest impact on their business in the next five years. of instructors, lack of a local population base to draw
By far, the weather (typically consistent/predictable/cold on, limited beginner terrain, peak time capacity limits,
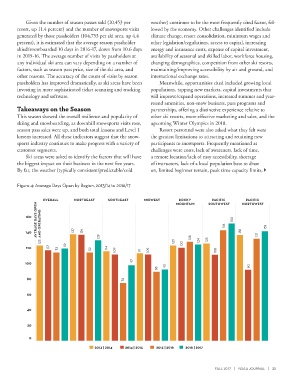
Figure 4: Average Days Open by Region, 2013/14 to 2016/17
OVERALL NORTHEAST SOUTHEAST MIDWEST MOUNTAIN SOUTHWEST NORTHWEST
PACIFIC
PACIFIC
ROCKY
AVERAGEDAYSOPEN ANDOPERATING
160
140
120
100
80
60
40
20
0
2013 | 2014 2014 | 2015 2015 | 2016 2016 | 2017
FALL 2017 | NSAA JOURNAL | 35