
Page 36 - NSAA 2017 Fall Journal
P. 36
2015-16 ($330.9 million) to 2016-17 ($269.9 million); however, capital improvement projects are represented in the data
capital expenditures are preliminarily projected to rebound to (because of non-response to the survey overall, and to the
$331.1 million (up 22.7 percent) in 2017-18 (figure 5). capital improvements question in particular).
Here is some detail on the categorization of the invest-
ment amounts: Season Pass Tracking
• Spending on other on-mountain facilities/support— and Visits per Passholder
the largest category of capital spending—declined from In a further effort to document ticket accounting patterns,
$157.2 million in 2015-16 to $132.7 million in 2016-17, resorts were asked to identify how they track season pass
but is expected to increase to $177 million in 2017-18. usage. About 35 percent of responding resorts scanned all
• Spending on lifts was up from $43.6 million in passholders in line, 32 percent estimated pass usage (typi-
2015-16 to $54.7 million in 2016-17, and is pro- cally by applying an assumed average days of use factor), 20
jected to rise to $71.1 million in 2017-18. percent used RFID, and 7 percent issued a daily ticket for
• Expenditures on real estate have been on a downward passholders. Finally, 6 percent used other counting methods
trend, declining from $109.2 million in 2015-16 to or estimates (such as a daily or seasonal percentage factor rel-
$72.2 million in 2016-17, with an anticipated contin- ative to lift tickets sold, counts at the lifts, periodic scanning
ued drop to $57.2 million in 2017-18. of passholders, or some combination of the above).
• Dollars invested on summer – and fall-specific By region, resorts in the Pacific Northwest are most likely
on-mountain facilities and support was $18.2 mil- to scan season passes or use RFID (90 percent combined),
lion in 2015-16, fell to $10.4 million in 2016-17, but closely followed by the Rocky Mountains and Pacific Southwest
is expected to recover to $25.8 million in 2017-18. (each 77 percent), with lower usage in the Northeast (44 per-
cent), Southeast (21 percent), and Midwest (21 percent).
It should be cautioned that a small number of large projects Resorts in the Midwest are the most likely to issue a daily ticket
can heavily impact the numbers, and that not all ski resort to passholders (28 percent, vs. 0 to 8 percent in other regions).
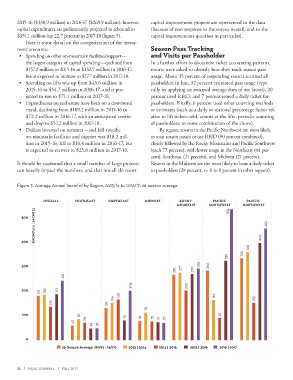
Figure 3: Average Annual Snowfall by Region, 2013/14 to 2016/17; 26-season average
OVERALL SOUTHEAST NORTHEAST MIDWEST ROCKY PACIFIC PACIFIC
MOUNTAIN SOUTHWEST NORTHWEST
SNOWFALLINCHES
500
400
300
200
100
0
26-Season Average (91/92 - 16/17) 2013 | 2014 2014 | 2015 2015 | 2016 2016 | 2017
34 | NSAA JOURNAL | FALL 2017