
Page 139 - AR DPBM-2016--SMALL
P. 139
Analisis & Pembahasan Manajemen Tata Kelola Dana Pensiun Laporan Keuangan Konsolidasi
Management Discussion & Analysis Good Pension Fund Governance Consolidated Financial Report
Apabila dirinci secara sektoral dalam 2 (dua) tahun terakhir Itemized on a sectoral basis for the last 2 (two) years was as
sebagai berikut: follows:
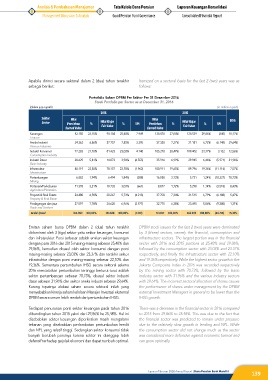
Portofolio Saham DPBM Per Sektor Per 31 Desember 2016
Stock Portfolio per Sector as at December 31, 2016
(dalam juta rupiah) (in million rupiah)
2016 2015
Sektor Nilai Nilai IHSG
Sector Perolehan % Nilai Wajar % SPI Perolehan % Nilai Wajar % SPI
Earned Value Fair Value Earned Value Fair Value
Keuangan 82.155 23,15% 90.104 25,48% 7.949 138.878 27,04% 138.539 29,86% (340) 18,17%
Finance
Aneka Industri 24.362 6,86% 27.757 7,85% 3.395 37.330 7,27% 31.181 6,72% (6.148) 29,64%
Various Industries
Industri Konsumsi 77.283 21,78% 81.423 23,03% 4.140 105.270 20,49% 108.402 23,37% 3.132 12,56%
Consumption Industry
Industri Dasar 20.629 5,81% 14.073 3,98% (6.555) 35.916 6,99% 29.945 6,46% (5.971) 31,96%
Basic Industry
Infrastruktur 80.119 22,58% 78.157 22,10% (1.962) 100.911 19,65% 89.796 19,36% (11.114) 7,57%
Infrastructure
Pertambangan 6.882 1,94% 6.494 1,84% (388) 16.058 3,13% 5.731 1,24% (10.327) 70,73%
Mining
Pertanian/Perkebunan 11.393 3,21% 10.732 3,03% (661) 8.817 1,72% 5.298 1,14% (3.518) 8,43%
Agriculture/Plantation
Properti & Real Estate 24.480 6,90% 20.267 5,73% (4.213) 37.703 7,34% 31.515 6,79% (6.188) 5,47%
Property & Real Estate
Perdagangan dan jasa 27.597 7,78% 24.620 6,96% (2.977) 32.775 6,38% 23.495 5,06% (9.280) 1,31%
Trade and Services
Jumlah | Total 354.899 100,00% 353.628 100,00% (1.272) 513.657 100,00% 463.902 100,00% (49.755) 15,32%
Emiten saham bursa DPBM dalam 2 (dua) tahun terakhir DPBM stock issuers for the last 2 (two) years were dominated
didominasi oleh 3 (tiga) sektor yaitu sektor keuangan, konsumsi by 3 (three) sectors, namely the financial, consumption and
dan infratsruktur. Porsi terbesar adalah emiten sektor keuangan infrastructure sectors. The largest portion was in the financial
dengan porsi 2016 dan 2015 masing-masing sebesar 25,48% dan sector with 2016 and 2015 portions at 25.48% and 29.86%,
29,86%, kemudian disusul oleh sektor konsumsi dengan porsi followed by the consumption sector with 23.03% and 23.37%
masing-masing sebesar 23,03% dan 23,37% dan terakhir sektor respectively, and finally the infrastructure sector with 22.10%
infrastruktur dengan porsi masing-masing sebesar 22,10% dan and 19.36% respectively. While the highest sector growth in the
19,36%. Sementara pertumbuhan IHSG secara sektoral selama Jakarta Composite Index in 2016 was recorded respectively
2016 mencatatkan pertumbuhan tertinggi berturut-turut adalah by the mining sector with 70.73%, followed by the basic
sektor pertambangan sebesar 70,73%, disusul sektor industri industry sector with 31.96% and the various industry sectors
dasar sebesar 31,96% dan sektor aneka industri sebesar 29,64%. with 29.64%. The incorrect sectoral allocation of shares causes
Kurang tepatnya alokasi saham secara sektoral inilah yang the performance of shares under management by the DPBM
menyebabkan kinerja saham kelolaan Manajer Investasi eksternal external Investment Managers in general to be lower than the
DPBM secara umum lebih rendah dari pertumbuhan IHSG. IHSG growth.
Terdapat penurunan porsi sektor keuangan pada tahun 2016 There was a decrease in the financial sector in 2016 compared
dibandingkan tahun 2015 yakni dari 29,86% ke 25,48%. Hal ini to 2015 from 29.86% to 25.48%. This was due to the fact that
disebabkan sektor keuangan diperkirakan masih mengalami the financial sector was predicted to remain under pressure
tekanan yang disebabkan perlambatan pertumbuhan kredit due to the relatively slow growth in lending and NPL. While
dan NPL yang relatif tinggi. Sedangkan sektor konsumsi tidak the consumption sector did not change much as the sector
banyak berubah porsinya karena sektor ini dianggap lebih was considered more defensive against economic turmoil and
defensif terhadap gejolak ekonomi dan dapat tumbuh optimal. can grow optimally.
Laporan Tahunan 2016 Annual Report | Dana Pensiun Bank Mandiri
139