
Page 188 - AR DPBM-2016--SMALL
P. 188
Ikhtisar Utama Laporan Manajemen Profil Dana Pensiun Bank Mandiri
Key Financial Highlights Management Report Dana Pensiun Bank Mandiri Profile
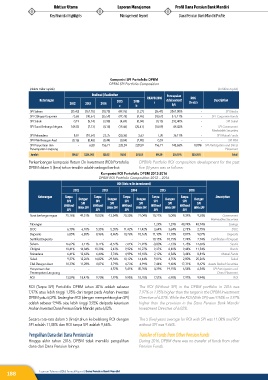
Komposisi SPI Portofolio DPBM
DPBM SPI Portfolio Composition
(dalam miliar rupiah) (in billion rupiah)
Realisasi | Realization Pencapaian
Keterangan 2015 2016 RKAPB 2016 Achievement ROG Description
2012 2013 2014 c b/c (b-a)/a
a b
SPI Saham (35,43) (167,70) (10,75) (49,76) (1,27) (36,47) 2867,80% - SPI Stocks
SPI Obligasi Korporasi 73,68 (40,67) (35,59) (42,78) (4,96) (18,62) 375,11% - SPI Corporate Bonds
SPI Sukuk 0,19 (5,14) (3,98) (4,69) (0,04) (0,13) 292,40% - SPI Sukuk
SPI Surat Berharga Negara 149,02 (7,13) (4,18) (19,46) (20,41) (10,09) 49,42% - SPI Government
Marketable Securities
SPI Reksadana 8,87 (10,64) 23,35 (20,36) 2,63 7,30 36,11% - SPI Mutual Funds
SPI Efek Beragun Aset (0,16) (0,48) (0,44) (0,04) (2,90) 0,59 - - SPI EBA
SPI Penyertaan dan - 6,80 156,71 228,59 228,59 156,71 145,86% 0,00% SPI Participation and Direct
Penempatan Langsung Placement
Jumlah 196,17 (224,96) 125,12 91,50 201,63 99,29 20,06% 120,35% Total
Perkembangan komposisi Return On Investment (ROI) Portofolio DPBM’s Portfolio ROI composition development for the past
DPBM dalam 5 (lima) tahun terakhir adalah sebagai berikut: five (5) years was as follows:
Komposisi ROI Portofolio DPBM 2012-2016
DPBM ROI Portfolio Composition 2012 – 2016
ROI (Return On Investment)
2012 2013 2014 2015 2016
Keterangan Tanpa Dengan Tanpa Dengan Tanpa Dengan Tanpa Dengan Tanpa Dengan Description
SPI SPI SPI SPI SPI
Without SPI Without SPI Without SPI Without SPI Without SPI
SPI With SPI SPI With SPI SPI With SPI SPI With SPI SPI With SPI
Surat berharga negara 25,16% 49,51% 10,53% -13,84% 20,30% 21,04% 10,21% 5,08% 9,39% 9,30% Government
Marketables Securities
Tabungan - - - - - - 1,29% 1,29% 48,74% 48,74% Savings
DOC 6,10% 6,10% 5,35% 5,35% 11,42% 11,42% 3,64% 3,64% 2,75% 2,75% DOC
Deposito 6,85% 6,85% 8,96% 8,96% 10,76% 10,76% 11,10% 11,10% 9,07% 9,07% Deposits
Sertifikat Deposito - - - - - - 10,15% 10,15% 7,74% 7,74% Certificates of Deposit
Saham 16,62% 5,11% 8,71% -8,52% 7,61% 27,92% -0,80% -7,53% 1,78% 14,66% Stocks
Obligasi 10,41% 14,84% 10,38% 2,43% 9,92% 10,27% 9,37% 8,89% 9,44% 11,54% Bonds
Reksadana 6,41% 12,63% 6,44% -5,74% 4,99% 18,10% 2,12% -8,54% 3,48% 8,81% Mutual Funds
Sukuk 9,37% 12,26% 14,82% -29,54% 10,12% 16,44% 9,01% 4,75% 2,80% 25,26% Sukuk
Efek Beragun Aset 10,33% 11,28% 8,07% 5,79% 4,73% 4,99% 7,44% 9,60% 17,31% 8,67% Assets Backed Securities
Penyertaan dan - - - 4,52% 5,41% 45,28% 4,39% 19,15% 6,54% 6,54% SPI Participation and
Penempatan Langsung Direct Placement
ROI 13,59% 18,42% 9,20% 1,92% 9,95% 18,20% 7,57% 6,90% 7,97% 9,94% ROI
ROI (Tanpa SPI) Portofolio DPBM tahun 2016 adalah sebesar The ROI (Without SPI) in the DPBM portfolio in 2016 was
7,97% atau lebih tinggi 1,95% dari target pada Arahan Investasi 7.97% or 1.95% higher than the target in the DPBM Investment
DPBM yaitu 6,02%. Sedangkan ROI (dengan memperhitungkan SPI) Directive of 6.02%. While the ROI (With SPI) was 9.94% or 3.92%
adalah sebesar 9,94% atau lebih tinggi 3,92% daripada ketentuan higher than the provision in the Dana Pensiun Bank Mandiri
Arahan Investasi Dana Pensiun Bank Mandiri yaitu 6,02%. Investment Directive of 6.02%.
Secara rata-rata dalam 5 (lima) tahun ke belakang ROI dengan The 5 (five) years average for ROI with SPI was 11.08% and ROI
SPI adalah 11,08% dan ROI tanpa SPI adalah 9,66%. without SPI was 9.66%.
Pengalihan Dana dari Dana Pensiun Lain Transfer of Funds from Other Pension Funds
Hingga akhir tahun 2016, DPBM tidak memiliki pengalihan During 2016, DPBM there was no transfer of funds from other
dana dari Dana Pensiun lainnya. Pension Funds.
188 Laporan Tahunan 2016 Annual Report | Dana Pensiun Bank Mandiri