
Page 189 - AR DPBM-2016--SMALL
P. 189
Analisis & Pembahasan Manajemen Tata Kelola Dana Pensiun Laporan Keuangan Konsolidasi
Management Discussion & Analysis Good Pension Fund Governance Consolidated Financial Report
Perbandingan Antara Target 2016, Realisasi 2016, dan Proyeksi 2017
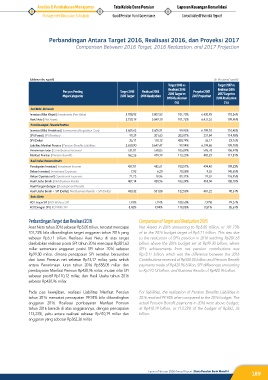
Comparison Between 2016 Target, 2016 Realization, and 2017 Projection
(dalama ribu rupiah) (in thousand rupiah)
Target 2016 vs Target 2017 vs
Realisasi 2016 Realisasi 2016
Pos-pos Penting Target 2016 Realisasi 2016 2016 Target vs Proyeksi 2017 2017 Target vs
Major Categories 2016 Target 2016 Realization 2017 Projection
2016 Realization 2016 Realization
(%) (%)
Aset Neto | Net Assets
Investasi (Nilai Wajar) | Investments (Fair Value) 5.708,92 5.807,53 101,73% 6.420,95 110,56%
Aset Neto | Net Assets 5.750,19 5.849,10 101,72% 6.431,53 109,96%
Posisi Keuangan | Financial Position
Investasi (Nilai Perolehan) | Investments (Acquisition Cost) 5.609,63 5.605,91 99,93% 6.189,10 110,40%
SPI (Posisi) | SPI (Position) 99,29 201,63 203,07% 231,84 114,98%
SPI (Delta) 26,17 110,12 420,79% 26,17 23,76%
Liabilitas Manfaat Pensiun | Pension Benefits Liabilities 5.650,90 5.647,47 99,94% 6.199,68 109,78%
Penerimaan Iuran | Contributions Received 531,01 558,05 105,09% 596,78 106,94%
Manfaat Pensiun | Pension Benefits 362,26 410,19 113,23% 483,23 117,81%
Hasil Usaha | Business Results
Pendapatan Investasi | Investment Income 437,01 452,61 103,57% 494,40 109,23%
Beban Investasi | Investment Expenses 7,92 6,20 78,28% 9,03 145,65%
Beban Operasional | Operational Expenses 21,23 18,96 89,31% 24,07 126,95%
Hasil Usaha Bersih | Net Business Results 407,14 420,96 103,39% 455,04 108,10%
Hasil Pengembangan | Development Results
Hasil Usaha Bersih + SPI (Delta) | Net Business Results + SPI (Delta) 433,32 531,08 122,56% 481,22 90,61%
Rasio | Ratio
ROI Tanpa SPI | ROI Without SPI 7,93% 7,97% 100,50% 7,92% 99,37%
ROI Dengan SPI | ROI With SPI 8,42% 9,94% 118,05% 8,51% 85,61%
Perbandingan Target dan Realisasi 2016 Comparison of Target and Realization 2016
Aset Neto tahun 2016 sebesar Rp5,85 triliun, tercatat mencapai Net Assets in 2016 amounting to Rp5.85 trillion, or 101.73%
101,73% bila dibandingkan target anggaran tahun 2016 yang of to the 2016 budget target of Rp5.71 trillion. This was due
sebesar Rp5,71 triliun. Realisasi Aset Neto di atas target to the realization of SPI’s position in 2016 reaching Rp201.63
disebabkan realisasi posisi SPI tahun 2016 mencapai Rp201,63 billion above the 2016 budget set at Rp99.30 billion, where
miliar sementara anggaran posisi SPI tahun 2016 sebesar SPI’s achievements from net pension contributions was
Rp99,30 miliar, dimana pencapaian SPI tersebut bersumber Rp73.17 billion, which was the difference between the 2016
dari Iuran Pensiun net sebesar Rp73,17 miliar, yaitu selisih Contributions received of Rp558.05 billion and Pension Benefit
antara Penerimaan Iuran tahun 2016 Rp558,05 miliar dan payments made of Rp420.96 billion, SPI differences amounting
pembayaran Manfaat Pensiun Rp420,96 miliar, mutasi nilai SPI to Rp110.12 billion, and Business Results of Rp420.96 billion.
sebesar positif Rp110,12 miliar, dan Hasil Usaha tahun 2016
sebesar Rp420,96 miliar.
Pada pos kewajiban, realisasi Liabilitas Manfaat Pensiun For liabilities, the realization of Pension Benefits Liabilities in
tahun 2016 mencatat pencapaian 99,94% bila dibandingkan 2016 reached 99.94% when compared to the 2016 budget. The
anggaran 2016. Realisasi pembayaran Manfaat Pensiun actual Pension Benefit payments in 2016 were above budget,
tahun 2016 berada di atas anggarannya, dengan pencapaian at Rp410.19 billion, or 113.23% of the budget of Rp362, 26
113,23%, yaitu antara realisasi sebesar Rp410,19 miliar dan billion.
anggaran yang sebesar Rp362,26 miliar.
Laporan Tahunan 2016 Annual Report | Dana Pensiun Bank Mandiri
189