
Page 183 - AR DPBM-2016--SMALL
P. 183
Analisis & Pembahasan Manajemen Tata Kelola Dana Pensiun Laporan Keuangan Konsolidasi
Management Discussion & Analysis Good Pension Fund Governance Consolidated Financial Report
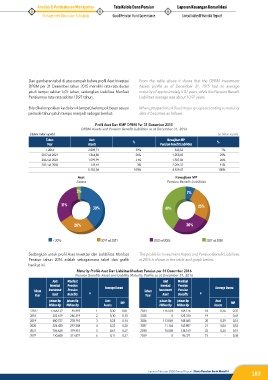
Dari gambaran tabel di atas nampak bahwa profil Aset Investasi From the table above it shows that the DPBM Investment
DPBM per 31 Desember tahun 2015 memiliki rata-rata durasi Assets profile as of December 31, 2015 had an average
jatuh tempo sekitar 5,07 tahun, sedangkan Liabilitas Manfaat maturity of approximately 5.07 years, while the Pension Benefit
Pensiunnya rata-rata sekitar 10,97 tahun. Liabilities average was about 10.97 years.
Bila dikelompokkan ke dalam 4 (empat) kelompok besar sesuai When grouped into 4 (four) major groups according to maturity
periode tahun jatuh tempo menjadi sebagai berikut: date it becomes as follows:
Profil Aset Dan KMP DPBM Per 31 Desember 2015
DPBM Assets and Pension Benefit Liabilities as at December 31, 2016
(dalam miliar rupiah) (in billion rupiah)
Tahun Aset % Kewajiban MP %
Year Assets Pension Benefit Liabilities
< 2016 2.009,71 39% 333,52 7%
2017 sd 2021 1.364,80 26% 1.253,83 25%
2022 sd 2026 1.599,99 31% 1.307,06 26%
2027 sd 2050 178,54 3% 2.045,32 41%
5.153,04 100% 4.939,47 100%
Aset Kewajiban MP
Assets Pension Benefit Liabilities
3% 7%
31% 25%
39% 41%
26% 26%
< 2016 2017 sd 2021 2022 sd 2026 2027 sd 2050
Sedangkan untuk profil Aset Investasi dan Lialibilitas Manfaat The profile for Investment Assets and Pension Benefit Liabilities
Pensiun tahun 2016 adalah sebagaimana tabel dan grafik in 2016 is shown in the table and graph below:
berikut ini:
Maturity Profile Aset Dan Liabilitas Manfaat Pensiun per 31 Desember 2016
Pension Benefits Asset and Liability Maturity Profile as at December 31, 2016
Aset Manfaat Aset Manfaat
Investasi Pensiun Average Durasi Investasi Pensiun Average Durasi
Tahun Investment Pension n Tahun Investment Pension n
Year Asset Benefits Year Asset Benefits
jutaan Rp jutaan Rp Aset jutaan Rp jutaan Rp Aset
Million Rp Million Rp Assets MP Million Rp Million Rp Assets MP
≤2017 1.766.132 45.993 1 0,30 0,01 2034 116.518 104.176 18 0,36 0,32
2018 283.619 286.319 2 0,10 0,10 2035 0 125.310 19 - 0,41
2019 480.727 278.710 3 0,25 0,14 2036 113.069 148.865 20 0,39 0,51
2020 324.430 297.208 4 0,22 0,20 2037 11.164 143.807 21 0,04 0,52
2021 706.628 319.951 5 0,61 0,27 2038 74.558 134.163 22 0,28 0,51
2022 110.608 311.822 6 0,11 0,32 2039 0 96.321 23 - 0,38
Laporan Tahunan 2016 Annual Report | Dana Pensiun Bank Mandiri
183