
Page 178 - AR DPBM-2016--SMALL
P. 178
Ikhtisar Utama Laporan Manajemen Profil Dana Pensiun Bank Mandiri
Key Financial Highlights Management Report Dana Pensiun Bank Mandiri Profile
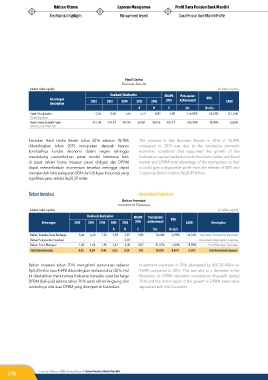
hasil Usaha
Business Results
(dalam miliar rupiah) (in billion rupiah)
Realisasi | Realization RKAPB Pencapaian
Keterangan 2012 2013 2014 2015 2016 2016 Achievement ROG CAGR
Description
A B C b/c (b-a)/a
Pajak Penghasilan 0,36 0,58 5,65 5,74 8,80 5,00 176,03% 53,24% 121,75%
Taxes Expense
Hasil Usaha Setelah Pajak 457,48 341,44 407,94 353,81 420,96 407,14 103,39% 18,98% -2,06%
Net Income After Tax
Kenaikan Hasil Usaha Bersih tahun 2016 sebesar 18,98% The increase in Net Business Results in 2016 of 18.98%
dibandingkan tahun 2015 merupakan dampak karena compared to 2015 was due to the conducive domestic
kondusifnya kondisi ekonomi dalam negeri sehingga economic conditions that supported the growth of the
mendukung pertumbuhan pasar modal Indonesia baik Indonesian capital markets in both the stock market and bond
di pasar saham bursa maupun pasar obligasi dan DPBM market and DPBM took advantage of the momentum so that
dapat memanfaatkan momentum tersebut sehingga dapat it could gain a disposable profit from the release of SBN and
memperoleh laba pelepasan SBN dan Obligasi Korporasi yang Corporate Bond of about Rp20.39 billion.
signifikan yaitu sekitar Rp20,39 miliar.
Beban Investasi Investment Expenses
Beban Investasi
Investment Expenses
(dalam miliar rupiah) (in billion rupiah)
Realisasi | Realization RKAPB Pencapaian
Keterangan 2012 2013 2014 2015 2016 2016 Achievement ROG CAGR Description
A B C b/c (b-a)/a
Beban Transaksi Surat Berharga 5,44 6,60 7,52 3,09 2,87 3,85 74,60% -6,99% -14,76% Securities Transaction Expenses
Beban Penyusutan Investasi - - - - 0,03 - - - - Investment Depreciation Expense
Beban Fund Manager 1,40 1,64 1,96 3,42 3,30 4,07 81,07% -3,43% 23,98% Fund Manager Expenses
Total Beban Investasi 6,83 8,24 9,48 6,50 6,20 7,92 78,32% -4,64% -2,39% Total Investment Expenses
Beban Investasi tahun 2016 mengalami penurunan sebesar Investment expenses in 2016 decreased by Rp0.30 billion or
Rp0,30 miliar atau 4,64% dibandingkan realisasi tahun 2015. Hal 4.64% compared to 2015. This was due to a decrease in the
ini disebabkan menurunnya frekuensi transaksi surat berharga frequency of DPBM securities transactions (buy-sell) during
DPBM (beli-jual) selama tahun 2016 serta akibat langsung dari 2016 and the direct result of the growth in DPBM asset value
tumbuhnya nilai aset DPBM yang disimpan di Kustodian. deposited with the Custodian.
178 Laporan Tahunan 2016 Annual Report | Dana Pensiun Bank Mandiri