
Page 25 - Town of Bedford FY 2018-2019 Budget.pdf
P. 25
&z ϮϬϭϴͲϮϬϭϵ KWd h ' d dKtE K& &KZ ͕ s/Z'/E/
unexpected needs. As of the last reported CAFR, the General Fund had 0.79 months in unassigned fund
balance and an unassigned fund balance that equated to 6.6% of annual revenues.
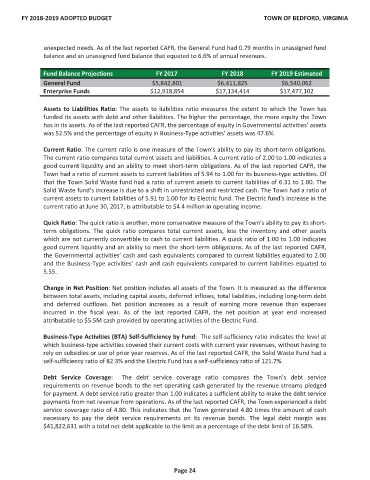
Fund Balance Projections FY 2017 FY 2018 FY 2019 Estimated
General Fund $5,842,801 $6,411,825 $6,540,062
Enterprise Funds $12,918,854 $17,134,414 $17,477,102
Assets to Liabilities Ratio: The assets to liabilities ratio measures the extent to which the Town has
funded its assets with debt and other liabilities. The higher the percentage, the more equity the Town
has in its assets. As of the last reported CAFR, the percentage of equity in Governmental activities’ assets
was 52.5% and the percentage of equity in Business-Type activities’ assets was 47.6%.
Current Ratio: The current ratio is one measure of the Town’s ability to pay its short-term obligations.
The current ratio compares total current assets and liabilities. A current ratio of 2.00 to 1.00 indicates a
good current liquidity and an ability to meet short-term obligations. As of the last reported CAFR, the
Town had a ratio of current assets to current liabilities of 5.94 to 1.00 for its business-type activities. Of
that the Town Solid Waste fund had a ratio of current assets to current liabilities of 6.31 to 1.00. The
Solid Waste fund’s increase is due to a shift in unrestricted and restricted cash. The Town had a ratio of
current assets to current liabilities of 5.91 to 1.00 for its Electric fund. The Electric fund’s increase in the
current ratio at June 30, 2017, is attributable to $4.4 million in operating income.
Quick Ratio: The quick ratio is another, more conservative measure of the Town’s ability to pay its short-
term obligations. The quick ratio compares total current assets, less the inventory and other assets
which are not currently convertible to cash to current liabilities. A quick ratio of 1.00 to 1.00 indicates
good current liquidity and an ability to meet the short-term obligations. As of the last reported CAFR,
the Governmental activities’ cash and cash equivalents compared to current liabilities equated to 2.00
and the Business-Type activities’ cash and cash equivalents compared to current liabilities equated to
5.55.
Change in Net Position: Net position includes all assets of the Town. It is measured as the difference
between total assets, including capital assets, deferred inflows, total liabilities, including long-term debt
and deferred outflows. Net position increases as a result of earning more revenue than expenses
incurred in the fiscal year. As of the last reported CAFR, the net position at year end increased
attributable to $5.5M cash provided by operating activities of the Electric Fund.
Business-Type Activities (BTA) Self-Sufficiency by Fund: The self-sufficiency ratio indicates the level at
which business-type activities covered their current costs with current year revenues, without having to
rely on subsidies or use of prior year reserves. As of the last reported CAFR, the Solid Waste Fund had a
self-sufficiency ratio of 82.3% and the Electric Fund has a self-sufficiency ratio of 121.7%.
Debt Service Coverage: The debt service coverage ratio compares the Town’s debt service
requirements on revenue bonds to the net operating cash generated by the revenue streams pledged
for payment. A debt service ratio greater than 1.00 indicates a sufficient ability to make the debt service
payments from net revenue from operations. As of the last reported CAFR, the Town experienced a debt
service coverage ratio of 4.80. This indicates that the Town generated 4.80 times the amount of cash
necessary to pay the debt service requirements on its revenue bonds. The legal debt margin was
$41,822,631 with a total net debt applicable to the limit as a percentage of the debt limit of 16.58%.
WĂŐĞ Ϯϰ