Page 373 - NUMINO_WB_6A
P. 373
105-B4-1
Circle Graph (1)
1. Use the circle graph to answer each question.
Example
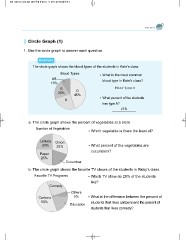
The circle graph shows the blood types of the students in Kate’s class.
Blood Types What is the most common
blood type in Kate’s class?
AB
10% What percent of the students
has type A?
B O
20% 45%
A
a. The circle graph shows the percent of vegetables at a store.
Number of Vegetables Which vegetable is there the least of?
Lettuce Onion What percent of the vegetables are
25% 30% cucumbers?
Paper
25%
Cucumber
b. The circle graph shows the favorite TV shows of the students in Ricky’s class.
Favorite TV Programs Which TV show do 20% of the students
Comedy like?
Cartoon Others What is the difference between the percent of
50% 5% students that likes cartoons and the percent of
students that likes comedy?
Education


