Page 376 - NUMINO_WB_6A
P. 376
105-B5-2
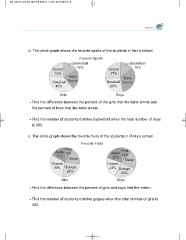
b. The circle graph shows the favorite sports of the students in Ann’s school.
Favorite Sports
Basketball Basketball
16%
Soccer 16% Soccer
27%
12% Table
Bassball Tennis Table
Bassball Tennis
45%
26%
Girls Boys
Find the difference between the percent of the girls that like table tennis and
the percent of boys that like table tennis.
Find the number of students that like basketball when the total number of boys
is 500.
c. The circle graph shows the favorite fruits of the students in Ricky’s school.
Favorite Fruits Apple Pear
20% 12%
Pear
Apple 9% Grapes Melon
17% Melon
Grapes 23% Orange
30% Orange
25%
26%
Girls Boys
Find the difference between the percent of girls and boys that like melon.
Find the number of students that like grapes when the total number of girls is
200.


