Page 379 - NUMINO_WB_6A
P. 379
105-B7-1
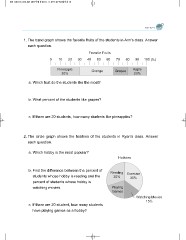
1. The band graph shows the favorite fruits of the students in Ann’s class. Answer
each question.
Favorite Fruits
0 10 20 30 40 50 60 70 80 90 100 (%)
Pineapple Orange Grapes Apple
30% 20%
a. Which fruit do the students like the most?
b. What percent of the students like grapes?
c. If there are 20 students, how many students like pineapples?
2. The circle graph shows the hobbies of the students in Ryan’s class. Answer
each question.
a. Which hobby is the most popular?
Hobbies
b. Find the difference between the percent of Reading Exercise
students whose hobby is reading and the 30%
percent of students whose hobby is 35%
watching movies.
Playing
c. If there are 20 student, how many students Games
have playing games as a hobby?
Watching Movies
15%


