Page 382 - NUMINO_WB_6A
P. 382
105-P1-2
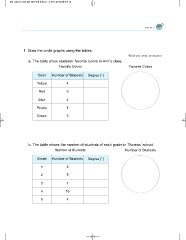
1. Draw the circle graphs using the tables. What you need: protractor
a. The table show students’ favorite colors in Ann’s class. Favorite Colors
Favorite Colors
Color Number of Students Degree ( )
Yellow 4
Red 6
Blue 4
Purple 1
Green 5
b. The table shows the number of students of each grade in Thomas’ school.
Number of Students Number of Students
Grade Number of Students Degree ( )
18
25
37
4 16
54


