Page 378 - NUMINO_WB_6A
P. 378
105-B6-2
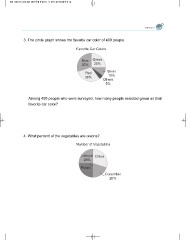
3. The circle graph shows the favorite car color of 400 people.
Favorite Car Colors
Blue Green
30% 25%
Red Silver
30% 10%
Others
5%
Among 400 people who were surveyed, how many people selected green as their
favorite car color?
4. What percent of the vegetables are onions?
Number of Vegetables
Lettuce Onion
25%
Potato
Cucumber
20%


