Page 380 - NUMINO_WB_6A
P. 380
105-B7-2
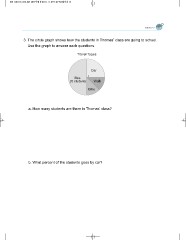
3. The circle graph shows how the students in Thomas’ class are going to school.
Use the graph to answer each questions.
Travel Types
Car
Bus Walk
20 students
Bike
a. How many students are there in Thomas’ class?
b. What percent of the students goes by car?
3. The circle graph shows how the students in Thomas’ class are going to school.
Use the graph to answer each questions.
Travel Types
Car
Bus Walk
20 students
Bike
a. How many students are there in Thomas’ class?
b. What percent of the students goes by car?


