Page 375 - NUMINO_WB_6A
P. 375
105-B5-1
Circle Graph (2)
1. Use the circle graph to answer each question.
Example
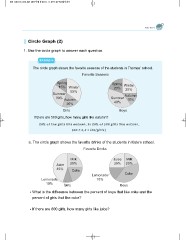
The circle graph shows the favorite seasons of the students in Thomas’ school.
Favorite Seasons
Spring Spring Winter
15% Winter 20% 25%
Summer 55%
30% Autumn Summer Autumn
40% 15%
20%
Girls Boys
If there are 500 girls, how many girls like autumn?
a. The circle graph shows the favorite drinks of the students in Kate’s school.
Favorite Drinks
Juice Milk Juice Milk
45% 25% 25% 20%
Coke Coke
Boys
Lemonade Lemonade
10% 15%
Girls
What is the difference between the percent of boys that like coke and the
percent of girls that like coke?
If there are 600 girls, how many girls like juice?


