Page 381 - NUMINO_WB_6A
P. 381
105-P1-1
Circle Graph Using a Protractor
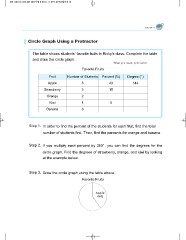
The table shows students’ favorite fruits in Ricky’s class. Complete the table
and draw the circle graph.
What you need: protractor
Favorite Fruits
Fruit Number of Students Percent (%) Degree ( )
Apple 8 40 144
Strawberry 3 15
Orange 2
Kiwi 15
Banana 6
Step 1. In order to find the percent of the students for each fruit, find the total
number of students first. Then, find the percents for orange and banana.
Step 2. If you multiply each percent by 360 , you can find the degrees for the
circle graph. Find the degrees of strawberry, orange, and kiwi by looking
at the example below.
Step 3. Draw the circle graph using the table above.
Favorite Fruits


