Page 383 - NUMINO_WB_6A
P. 383
105-P2-1
Draw Graphs
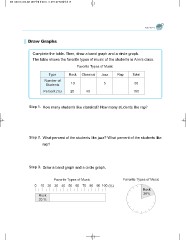
Complete the table. Then, draw a band graph and a circle graph.
The table shows the favorite types of music of the students in Ann’s class.
Favorite Types of Music
Type Rock Classical Jazz Rap Total
Number of 10 5 50
Students
Percent (%) 20 40 100
Step 1. How many students like classical? How many students like rap?
Step 2. What percent of the students like jazz? What percent of the students like
rap?
Step 3. Draw a band graph and a circle graph.
Favorite Types of Music Favorite Types of Music
0 10 20 30 40 50 60 70 80 90 100 (%)
Rock
Rock 20%
20 %


