Page 384 - NUMINO_WB_6A
P. 384
105-P2-2
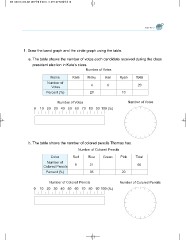
1. Draw the band graph and the circle graph using the table.
a. The table shows the number of votes each candidate received during the class
president election in Kate’s class.
Number of Votes
Name Kate Ricky Ann Ryan Total
Number of 46 20
Votes
Percent (%) 20 10
Number of Votes Number of Votes
0 10 20 30 40 50 60 70 80 90 100 (%)
b. The table shows the number of colored pencils Thomas has.
Number of Colored Pencils
Color Red Blue Green Pink Total
9 21 20 60
Number of 35
Colored Pencils
Percent (%)
Number of Colored Pencils Number of Colored Pencils
0 10 20 30 40 50 60 70 80 90 100 (%)


