Page 387 - NUMINO_WB_6A
P. 387
105-P4-1
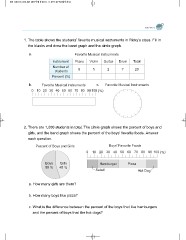
1. The table shows the students’ favorite musical instruments in Ricky’s class. Fill in
the blanks and draw the band graph and the circle graph.
a. Favorite Musical Instruments
Instrument Piano Violin Guitar Drum Total
6 5 2 7 20
Number of
students
Percent (%)
b. Favorite Musical Instruments c. Favorite Musical Instruments
0 10 20 30 40 50 60 70 80 90 100 (%)
2. There are 1,000 students in total. The circle graph shows the percent of boys and
girls, and the band graph shows the percent of the boys’ favorite foods. Answer
each question.
Percent of Boys and Girls Boys' Favorite Foods
0 10 20 30 40 50 60 70 80 90 100 (%)
Boys Girls Hamburger Pizza
55 % 45 % Salad Hot Dog
a. How many girls are there?
b. How many boys like pizza?
c. What is the difference between the percent of the boys that like hamburgers
and the percent of boys that like hot dogs?


