
Page 12 - 2. FB KD 3.3 OK
P. 12
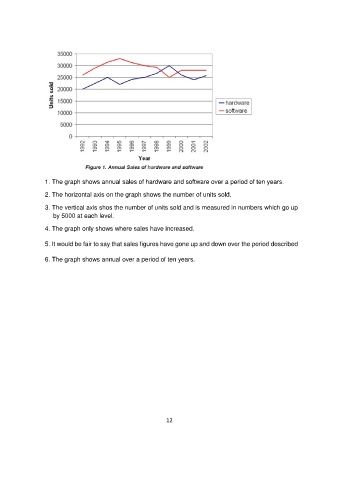
1. The graph shows annual sales of hardware and software over a period of ten years.

                 2. The horizontal axis on the graph shows the number of units sold.

                 3. The vertical axis shos the number of units sold and is measured in numbers which go up
                    by 5000 at each level.

                 4. The graph only shows where sales have increased.


                 5. It would be fair to say that sales figures have gone up and down over the period described

                 6. The graph shows annual over a period of ten years.


                                                           12