
Page 13 - Sample jcl
P. 13
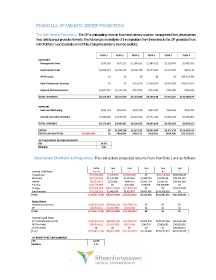
FINANCIALS: GP AND DATA CENTER PROJECTIONS

                      The 1547 General Partnership. The GP is anticipating revenue from three primary sources: management fees, development
                      fees, and sponsor promote interests. The following is an analysis of the projections from these fees to the GP generated from
                      both Portfolio 1 and 2 (details on Portfolio 2 targeted assets in the next section):


                    Data Center (Portfolio 1) Projections. The real estate projected returns from Portfolio 1 are as follows:


                                                      Initial   Year     Year      Year     Year      Year
                   Levered Cash Flows:                Year 0    1         2        3         4        5
                   Orangeburg                       ($54,792,630)  ($118,363)  ($8,500,004)  $0  ($28,314,466)  $159,543,627
                   Wyoming                          ($24,131,870)  $1,311,120  $1,387,661  $1,465,719  $1,545,326  $38,991,319
                   Hawaii                           ($8,282,063)  $223,860  $986,761  $1,502,724  $1,530,397  $18,903,268
                   Toronto                          ($18,115,869)  $0   $127,428  $178,756  $34,908,840  $0
                   Chicago                          ($19,209,550)  ($45,310,996)  ($12,038,104)  $0  $0  $134,424,467
                   San Francisco                    ($52,285,232)  $3,042,474  $5,615,457  $4,067,485  $143,590,918  $0
                   Total                           ($176,817,214) ($40,851,905)  ($12,420,801)  $7,214,684  $153,261,015  $351,862,681

                   Equity Draws
                   Institutional Investor          ($167,976,353) ($38,809,310)  ($11,799,761)  $0  $0  $0
                   GP                               ($8,840,861)  ($2,042,595)  ($621,040)  $0  $0    $0
                   Total                           ($176,817,214) ($40,851,905)  ($12,420,801)  $0  $0  $0
                   Total Net Cash Flows
                   LP / Institutional Investor     ($167,976,353) ($38,809,310)  ($11,799,761)  $6,853,950  $145,597,964  $314,636,396
                   GP (Pro Rata)                    ($8,840,861)  ($2,042,595)  ($621,040)  $360,734  $7,663,051  $16,559,810
                   GP (Promote)                        $0       $0        $0       $0        $0    $20,666,475
                   Total                           ($176,817,214) ($40,851,905)  ($12,420,801)  $7,214,684  $153,261,015  $331,196,206

                   CO-INVESTOR RETURN SUMMARY
                   IRR                                18.9%
                   Multiple                           2.1x