
Page 81 - Clackamas County Watertourism Strategic Plan. Final.v3
P. 81
STRATEGIC PLAN FOR WATER-BASED TOURISM IN CLACKAMAS COUNTY, OREGON THE MARKET
5-39
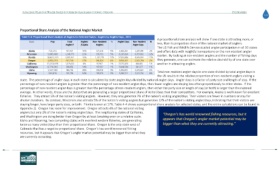
Proportional Share Analysis of the National Angler Market
Table 5-4: Proportional Share Analysis of Anglers for Selected States: Anglers by Anglers Days , 2011
A proportional share analysis will show if one state is attracting more, or
State Pop Total Anglers Non- Resident % Angler Days Non- Resident % less, than its proportion share of the national market of anglers.
Anglers† /Capita Anglers Angler Days
The US Fish and Wildlife Service studied angler participation in all 50 states
Alaska 710,231 537,927 76% 327,418 5% 4,360,282 1,287,096 2% and offers data with insightful comparisons on the non-resident angler
Wisconsin 5,686,986 1,246,775 22% 336,753 5% 21,283,610 6,707,662 12% market. By looking at non-resident anglers and the number of fishing days
Florida 18,801,310 3,091,952 16% 1,197,279 17% 57,593,836 9,543,924 17%
Oregon 3,831,074 637,746 17% 264,424 4% 5,658,437 1,262,784 2% they generate, one can estimate the relative desirability of one state over
California 37,253,956 1,673,633 4% 97,967 1% 23,753,676 486,605 1% another in attracting anglers.
Washington 6,724,540 938,053 14% 102,562 1% 13,448,784 341,327 1%
Idaho 1,567,582 446,718 28% 208,418 3% 5,506,803 3,341,667 6% Total non-resident angler days in one state divided by total angler days in
Wyoming 563,626 302,758 54% 193,076 3% 5,340,231 3,331,254 6%
the US results in the relative proportion of non-resident anglers visiting a
state. The percentage of angler days in each state is calculated by state angler days divided by national angler days. Angler days is a factor of party size and length of stay. If the
percentage of non-resident anglers is greater than the percentage of non-resident angler days, then fewer anglers are staying less often proportionally to other states. If the
percentage of non-resident angler days is greater than the percentage of non-resident anglers, then either the party size or length of stay (or both) is larger than the national
average. In other words, those are the states that are generating a larger proportional share of visitor/days than their competitors. For example, Alaska is well known for excellent
fisheries. They attract 5% of the nation’s visiting anglers. However, they only generate 2% of the nation’s visiting angler/days. Their visitors are fewer in numbers or stay for
shorter durations. By contrast, Wisconsin also attracts 5% of the nation’s visiting anglers but generates 12% of the nation’s visiting angler/days, indicating that their visitors are
staying longer, have larger party sizes, or both. Florida is even at 17%. Table 4-4 shows a proportional share analysis for selected states, and the entire calculations can be found in
Appendix 2). Oregon has room for improvement. Oregon attracts 4% of the national visiting
anglers but only 2% of the nation’s visiting angler/days. The neighboring states of California, “Oregon’s has world renowned fishing resources, but it
and Washington are doing better than Oregon by at least breaking even on a relative scale.
Idaho and Wyoming, two competing states with excellent western fisheries, are generating appears that Oregon’s angler market potential may be
twice as many visitor/days than their proportional share. Oregon is the only state west of bigger than what they are currently attracting.”
Colorado that has a negative proportional share. Oregon’s has world renowned fishing
resources, but it appears that Oregon’s angler market potential may be bigger than what they
are currently attracting.