
Page 29 - CNB Bank Shares 2018 Annual Report
P. 29
CNB BANK SHARES, INC. AND SUBSIDIARIES CNB BANK SHARES, INC. AND SUBSIDIARIES
Notes to Consolidated Financial Statements Notes to Consolidated Financial Statements
Consumer loans are underwritten in a manner that verifies the borrower’s capacity to pay, 2017
creditworthiness, and proper valuation of the collateral. The structure of the loan is dependent on the Agricultural Real estate
Commercial
purpose and collateral being pledged as security. Real estate production Other Construction Residential Farmland Consumer Total
At December 31, 2018 and 2017, the Banks had loans outstanding to the agricultural sector of $287,905,883 Reserve for possible loan losses: $ 2,370,694 1,191,671 3,048,289 310,497 1,078,305 501,442 266,571 8,767,469
Beginning balance
and $217,476,960, respectively, which comprised 30.5% and 30.4%, respectively, of the Banks’ total loan Charge-offs (189,950) (1,627,365) (612,144) − (157,557) − (217,496) (2,804,512)
361,954
−
24,882
244,687
1,350
−
portfolio. The Banks’ agricultural credits are concentrated in the south-central Illinois area and are generally Recoveries 40,467 2,055,330 (112,149) 43,639 50,568 29,279 189,453 2,254,528
155
48,821
Provision
fully secured with either growing crops, farmland, livestock, and/or machinery and equipment. Such loans Ending balance $ 2,270,032 1,620,986 2,568,683 354,136 971,471 530,721 263,410 8,579,439
are subject to the overall national effects of the agricultural economy, as well as the local effects relating to Reserve allocations:
their south-central Illinois location. Individually evaluated
for impairment $ 71,362 345,597 91,178 − − − 25,913 534,050
Collectively evaluated
The aggregate amount of loans to executive officers and directors and loans made for the benefit of executive for impairment 2,198,670 1,275,389 2,477,505 354,136 971,471 530,721 237,497 8,045,389
officers and directors was $4,700,696 and $4,180,805 at December 31, 2018 and 2017, respectively. Such Ending balance $ 2,270,032 1,620,986 2,568,683 354,136 971,471 530,721 263,410 8,579,439
loans were made in the normal course of business on substantially the same terms, including interest rates Loans:
and collateral, as those prevailing at the same time for comparable transactions with other persons, and did Individually evaluated $ 4,105,879 6,903,414 1,523,636 49,999 2,296,168 17,537,326 424,435 32,840,857
for impairment
not involve more than the normal risk of collectibility. A summary of activity for loans to executive officers Collectively evaluated
174,829,304
and directors for the year ended December 31, 2018 is as follows: for impairment $ 178,935,183 77,236,672 132,681,460 39,167,673 132,333,051 115,799,548 11,261,705 683,309,413
134,205,096
Ending balance
134,629,219 133,336,874 11,686,140 716,150,270
39,217,672
84,140,086
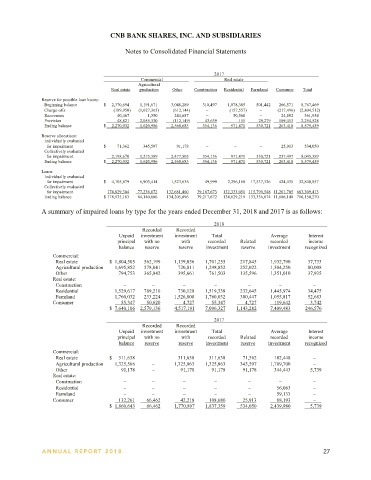
Balance, December 31, 2017 $ 4,180,805 A summary of impaired loans by type for the years ended December 31, 2018 and 2017 is as follows:
New loans made 5,016,856
Payments received (4,556,008) 2018
Other changes 59,043 Recorded Recorded
Balance, December 31, 2018 $ 4,700,696 Unpaid investment investment Total Average Interest
recorded
income
recorded
with
principal with no reserve investment Related investment recognized
reserve
balance
reserve
Other changes represent changes due to the change in the composition of officers and directors of the Commercial:
Company and Banks. Real estate $ 1,804,505 562,199 1,139,056 1,701,255 217,845 1,932,790 37,733
Agricultural production 1,695,852 578,041 720,811 1,298,852 252,022 1,504,250 80,008
Following is an analysis of the reserve for possible loan losses by loan type and those that have been Other 794,753 365,842 395,661 761,503 135,596 1,351,010 37,935
Real estate:
specifically evaluated or evaluated in aggregate at December 31, 2018 and 2017: Construction − − − − − − −
Residential 1,529,617 789,210 730,128 1,519,338 232,645 1,445,974 34,475
2018 Farmland 1,760,032 233,224 1,526,808 1,760,032 300,447 1,055,817 52,683
Commercial Real estate Consumer 55,347 50,620 4,727 55,347 4,727 119,642 3,742
Agricultural $ 7,640,106 2,579,136 4,517,191 7,096,327 1,143,282 7,409,483 246,576
Real estate production Other Construction Residential Farmland Consumer Total
2017
Reserve for possible loan losses: Recorded Recorded
Beginning balance $ 2,270,032 1,620,986 2,568,683 354,136 971,471 530,721 263,410 8,579,439
Charge-offs (201,144) (460,533) (719,580) − (200,939) (1,143) (135,755) (1,719,094) Unpaid investment investment Total Average Interest
Recoveries 240,337 20,664 67,408 − 21,035 1,143 70,722 421,309 principal with no with recorded Related recorded income
Provision 358,453 705,453 786,785 140,629 529,895 420,521 159,378 3,101,114 balance reserve reserve investment reserve investment recognized
Ending balance $ 2,667,678 1,886,570 2,703,296 494,765 1,321,462 951,242 357,755 10,382,768
Commercial:
Reserve allocations: Real estate $ 311,638 − 311,638 311,638 71,362 182,448 −
Individually evaluated Agricultural production 1,325,566 − 1,325,863 1,325,863 345,597 1,709,700 −
for impairment $ 217,845 252,022 135,596 − 232,645 300,447 4,727 1,143,282 Other 91,178 − 91,178 91,178 91,178 344,443 5,739
Collectively evaluated
for impairment 2,449,833 1,634,548 2,567,700 494,765 1,088,817 650,795 353,028 9,239,486 Real estate:
Ending balance $ 2,667,678 1,886,570 2,703,296 494,765 1,321,462 951,242 357,755 10,382,768 Construction − − − − − − −
Residential − − − − − 56,063 −
Loans: Farmland − − − − − 59,133 −
Individually evaluated
for impairment $ 16,480,565 9,292,180 11,590,753 − 3,163,645 18,005,512 28,510 58,561,165 Consumer 132,261 66,462 42,218 108,680 25,913 88,193 −
Loans acquired with deteriorated $ 1,860,643 66,462 1,770,897 1,837,359 534,050 2,439,980 5,739
credit quality 1,176,936 246,235 500,519 − 1,243,149 233,224 50,620 3,450,683
Collectively evaluated
for impairment 209,840,913 95,109,578 149,723,392 50,010,853 184,024,786 165,019,154 28,167,954 881,896,630
Ending balance $ 227,498,414 104,647,993 161,814,664 50,010,853 188,431,580 183,257,890 28,247,084 943,908,478
26 ANNUAL REPOR T 2018 ANNUAL REPOR T 2018 27